This page contains Amazon affiliate links, which means we may earn a small commission at no additional cost to you if you make a purchase through those links.
Okay, there’s an elephant in the room—you’ve been asked to share some data, but you’ve never really been trained how to actually design it. Sure, you know how to functionally create a pie chart or a bar graph, but are you really doing it right? Is a pie chart really the right choice? (Usually it’s not!) How should I use colors, lines, textures, and positionings? Is there a method for writing an effective chart title?
Curiously, many professionals are expected to collect, analyze, and share data—often regularly—but few (myself included) were every formally trained in how to effectively communicate it. That’s a scary thought considering how many chart and graph options there are and just how easy it can be to do it wrong.
Fortunately, there are some really good books out there that make the process a whole lot easier and I wanted to share some of the best books I’ve come across to learn the fundamentals of data visualization.
The Visual Display of Quantitative Information
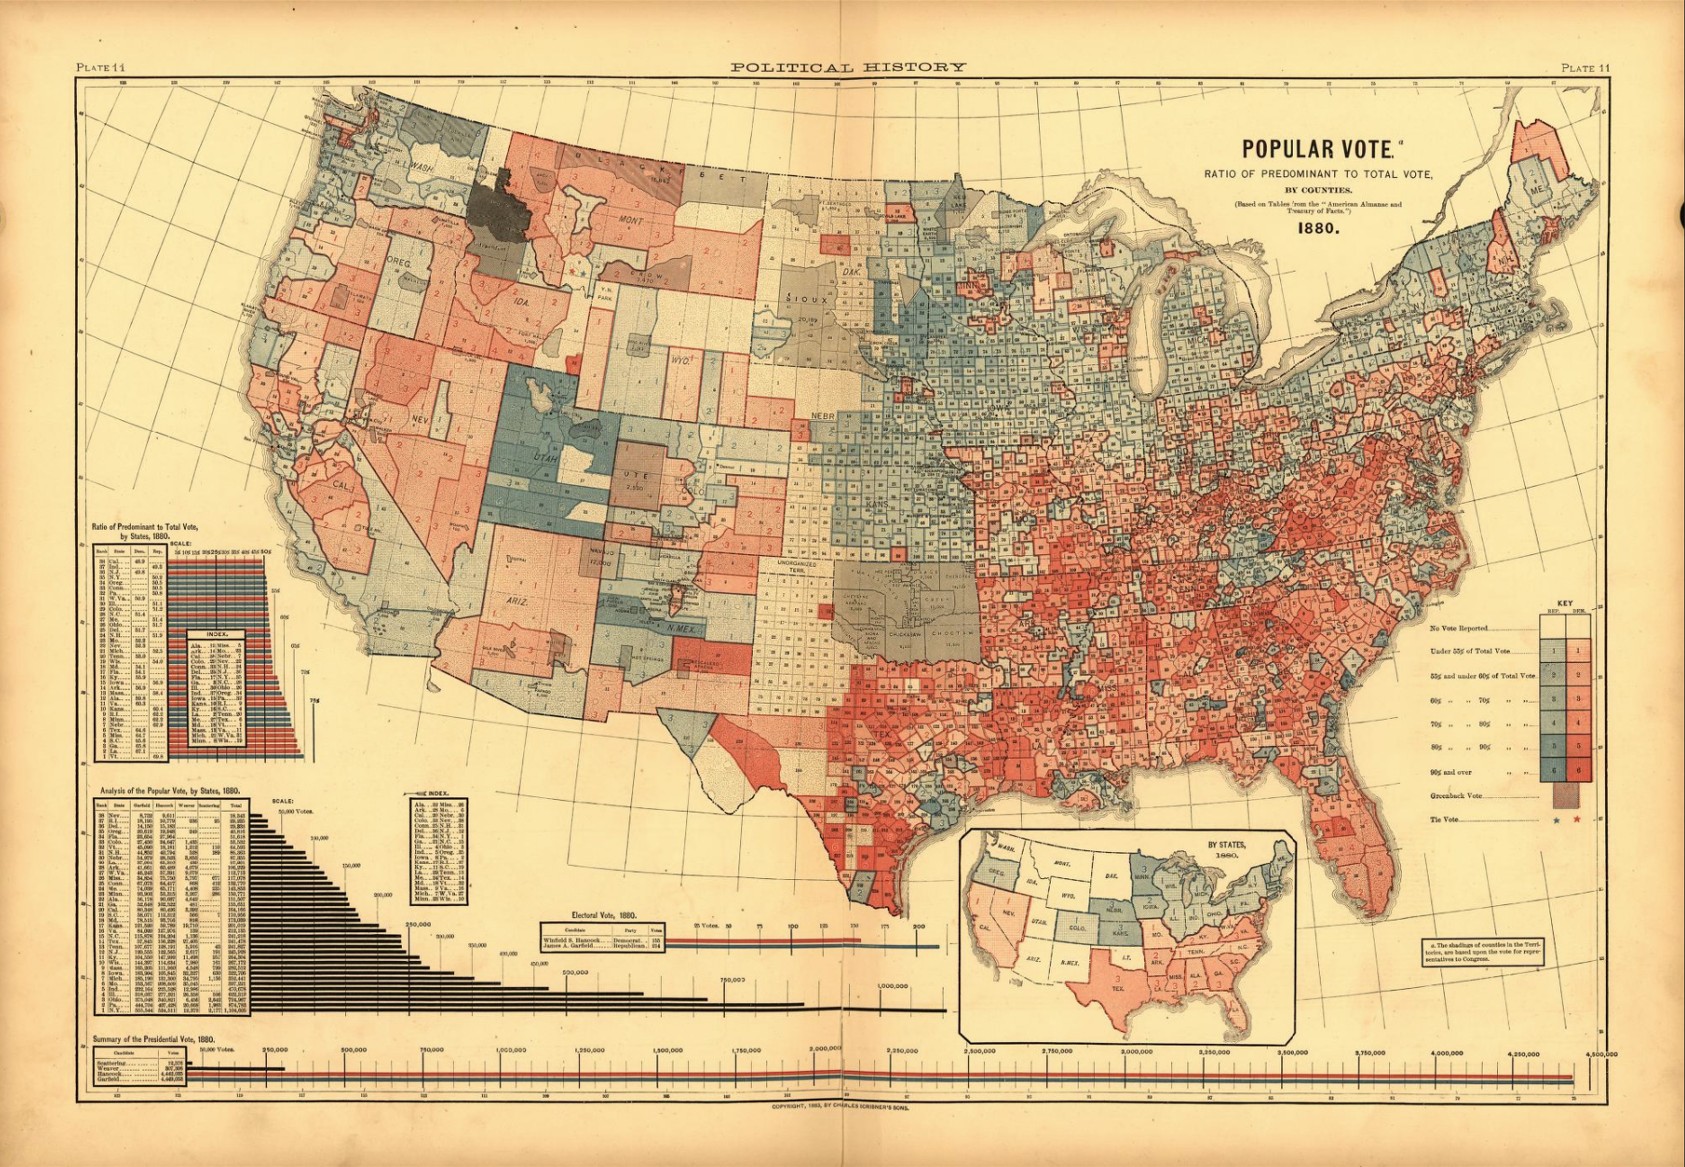
If you’re getting started with data visualization (or, even if you’re an expert and haven’t read it yet), The Visual Display of Quantitative Information is one of the best places you can begin. This book won’t teach you which buttons to click or which chart type is trending right now. Instead, it teaches you how to think about data visualization—and that’s what makes it so valuable. Edward Tufte walks you through real charts, maps, and graphics, showing why some make data clearer while others quietly distort it. Along the way, you’ll learn ideas like data-ink ratio, chartjunk, and graphical integrity, which give you a vocabulary for judging visualizations you see every day.
Best part about this book: It’s a classic. Written in the 1980s, it’s widely recognized as canonical reading in data visualization. The book immediately gets you in the correct mindest for thinking about how data visualization impacts understanding.
Reading this book will train your eye. You’ll start noticing when a chart is helping you understand something—and when it’s getting in the way. You’ll also learn how small design choices can influence meaning, credibility, and trust. That’s incredibly useful if you’re creating charts for reports, presentations, research, or public audiences.
If you’re new to data visualization, this book gives you a strong foundation that will save you time and mistakes later. It helps you develop good habits early and gives you a clear sense of what “good” data visualization actually looks like, no matter what tools you use.
Storytelling with Data
If you’re learning data visualization and want practical guidance you can apply right away, Storytelling with Data by Cole Nussbaumer Knaflic is an excellent next read. This book focuses on how to communicate insights clearly by shaping data into a narrative your audience can follow. Rather than overwhelming you with theory, Knaflic breaks the process down into approachable steps—clarifying your message, choosing the right chart, and directing attention to what matters most.
Best part about this book: Makes data visualization extremely accessible. The concept of storytelling really hits home and Knaflic makes the process of communicating with data simple and straightforward.
Reading this book will help you think like a communicator, not just a chart-maker. You’ll learn how to remove clutter, use emphasis intentionally, and design visuals that guide your audience toward a specific takeaway. The examples feel familiar and practical, especially if you work with business reports, presentations, or dashboards. Many of the techniques are simple, but they’re powerful because they’re grounded in how people actually read and interpret visuals.
If you’re new to data visualization, Storytelling with Data helps you bridge the gap between having data and communicating insight. It shows you how to turn charts into clear messages, avoid common mistakes, and make your work easier for others to understand and act on.
Effective Data Visualization
If you want to build a solid, practical foundation in actual data visualization design, Effective Data Visualization by Stephanie D. H. Evergreen is an excellent resource to have on your shelf. This book is especially helpful if you’re working with real-world data and need your visuals to be accurate, ethical, and easy to understand. Evergreen focuses on making data accessible to non-expert audiences, which is where many visualizations succeed or fail.
Best part about this book: Evergreen’s “Ninja Levels,” where she explains the time, effort, and difficulty level for creating different types of charts and graphs is very accessible. She walks you through how to create actual graphics using tools like Microsoft Excel.
Reading this book will help you make better design decisions with confidence. Evergreen explains how people perceive charts, how to choose appropriate visual forms, and how to avoid common pitfalls that lead to confusion or misinterpretation. The guidance is clear, grounded in research, and paired with practical examples that show exactly how small changes can dramatically improve clarity.
If you’re new to data visualization, Effective Data Visualization helps you develop habits that prioritize understanding over decoration. It gives you a strong sense of responsibility as a communicator—showing you not just how to make charts look better, but how to make them work better for the people who need to use them.
Effective Data Storytelling
If you want to go beyond making clear charts and start communicating insight with impact, Effective Data Storytelling by Brent Dykes is a strong addition to your reading list. This book focuses on how data, narrative, and visuals work together to influence understanding and decision-making. Rather than treating storytelling as a soft skill, Dykes shows how it can be structured, intentional, and grounded in evidence.
Best part about this book: Dykes takes a deeper dive into the psychology and processes for creating data visualization. It’s a little more advanced than the other books, but really descriptive and helpful.
Reading this book will help you think more strategically about how data fits into a larger message. You’ll learn how to frame insights around audience needs, build narrative flow, and connect data to context, emotion, and purpose—without sacrificing accuracy. The examples are especially useful for business, analytics, and leadership contexts, where the goal isn’t just to show data, but to drive action.
If you’re new to data visualization or analytics, Effective Data Storytelling helps you understand why charts alone aren’t enough. It shows you how to combine analysis, visuals, and story so your data doesn’t just inform, but actually resonates and moves people to act.
The Wall Street Journal Guide to Information Graphics
If you want to learn how data visualization works in high-stakes, real-world journalism, The Wall Street Journal Guide to Information Graphics by Dona M. Wong is an excellent read. This book pulls back the curtain on how one of the world’s most respected newsrooms designs charts and graphics that must be clear, fast, and trustworthy. Rather than focusing on theory alone, Wong emphasizes practical decision-making under real constraints—limited space, tight deadlines, and diverse audiences.
The best part about this book: Simple dos and don’ts for many types of charts and graphs. It’s a really short read but a great go-to resource for using visuals to display things like time, places, people, money, and so forth.
Reading this book will sharpen your judgment about when to use certain chart types and when to avoid them. Wong clearly explains the dos and don’ts of presenting numbers, comparisons, and trends, showing how small design choices can either clarify or distort meaning. The guidance is grounded in editorial standards, which makes it especially valuable if accuracy and credibility matter in your work.
If you’re new to data visualization, this book helps you develop a journalist’s mindset: clarity first, evidence always, and no unnecessary embellishment. It teaches you how to present data so people can understand it quickly, trust it, and move on informed rather than confused.