
Sunburst Chart: How to Show Hierarchies and Proportions in a Circular Layout
A sunburst chart helps visualize hierarchical data using concentric rings that expand outward from a central category. Use it to show how large categories break into smaller subcategories while still maintaining a sense of proportion and structure.
Turn to a sunburst chart when hierarchy and composition both matter. Instead of stacking categories in rows or columns, the chart organizes data in layers around a center point, making relationships feel connected and continuous. Each ring represents another level in the hierarchy, allowing viewers to explore structure at multiple depths.
Sunburst charts are especially effective when storytelling involves nested relationships. They combine the clarity of hierarchical diagrams with the visual appeal of circular layouts, making complex structures easier to explore.
Related Charts and Graphs
Several visuals relate closely to sunburst charts and may be better choices depending on the goal.
- Treemaps show hierarchical proportions using nested rectangles instead of circular segments.
- Icicle charts present hierarchy in a linear, layered structure.
- Radial tree diagrams emphasize branching relationships rather than proportional size.
- Pie and donut charts show parts of a whole but do not display multiple hierarchical levels.
- Stacked bar charts compare composition across categories rather than within nested structures.
Choosing between these options depends on whether the focus is structure, proportion, or comparison across groups.
What a Sunburst Chart Is
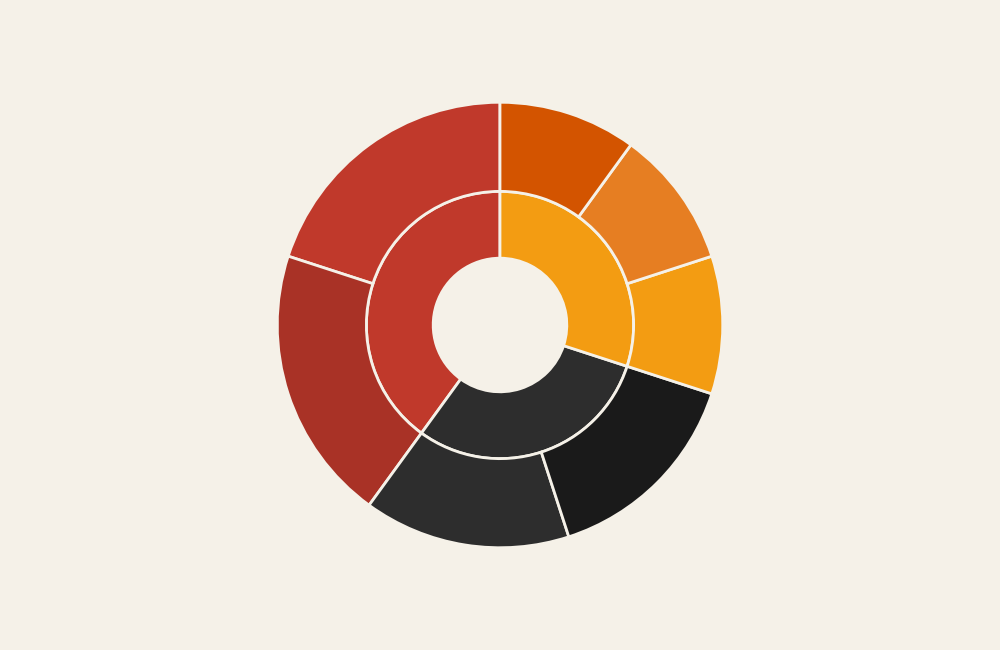
A sunburst chart displays hierarchical data using rings arranged around a central node. The innermost circle represents the highest-level category, and each outer ring represents deeper levels of the hierarchy.
Common elements include:
- Concentric rings showing levels of hierarchy
- Segments sized according to value or proportion
- Color coding to group related categories
- Interactive or labeled layers revealing detail
The width of each segment reflects its contribution relative to its parent category. As layers expand outward, viewers can see how large themes break into smaller components.
Unlike traditional trees or organizational diagrams, sunburst charts emphasize proportion as much as structure. This dual focus makes them useful for both exploration and storytelling.
When to Use a Sunburst Chart
Use a sunburst chart when the goal is to show hierarchical relationships while also emphasizing proportional contribution.
This visual works especially well when the goal is to:
- Show nested categories within a system
- Explore multilevel composition
- Reveal how subcategories contribute to larger groups
- Present complex structures in a compact space
- Encourage exploratory interaction with data
Sunburst charts are particularly effective when viewers benefit from seeing both the big picture and the detailed breakdown at the same time. The circular format allows multiple levels to coexist without overwhelming the layout.
Types of Data Sets That Work Best for a Sunburst Chart
Sunburst charts work best with hierarchical datasets where each item belongs to a parent category.
Strong candidates include:
- Website navigation structures
- Organizational or departmental hierarchies
- Product category breakdowns
- Budget allocation across nested programs
- File system or directory structures
- Biological classification systems
Each level of the hierarchy should be clearly defined. Data that lacks clear parent-child relationships may feel confusing in a sunburst layout.
Because the chart relies on proportion, values should represent meaningful quantities rather than arbitrary labels.
Real-World Examples of a Sunburst Chart
Sunburst charts appear frequently in analytics dashboards, research visualization, and digital storytelling where hierarchical structure needs to remain visible.
Website Navigation or Content Structure
Show how top-level pages branch into sections, categories, and individual content.
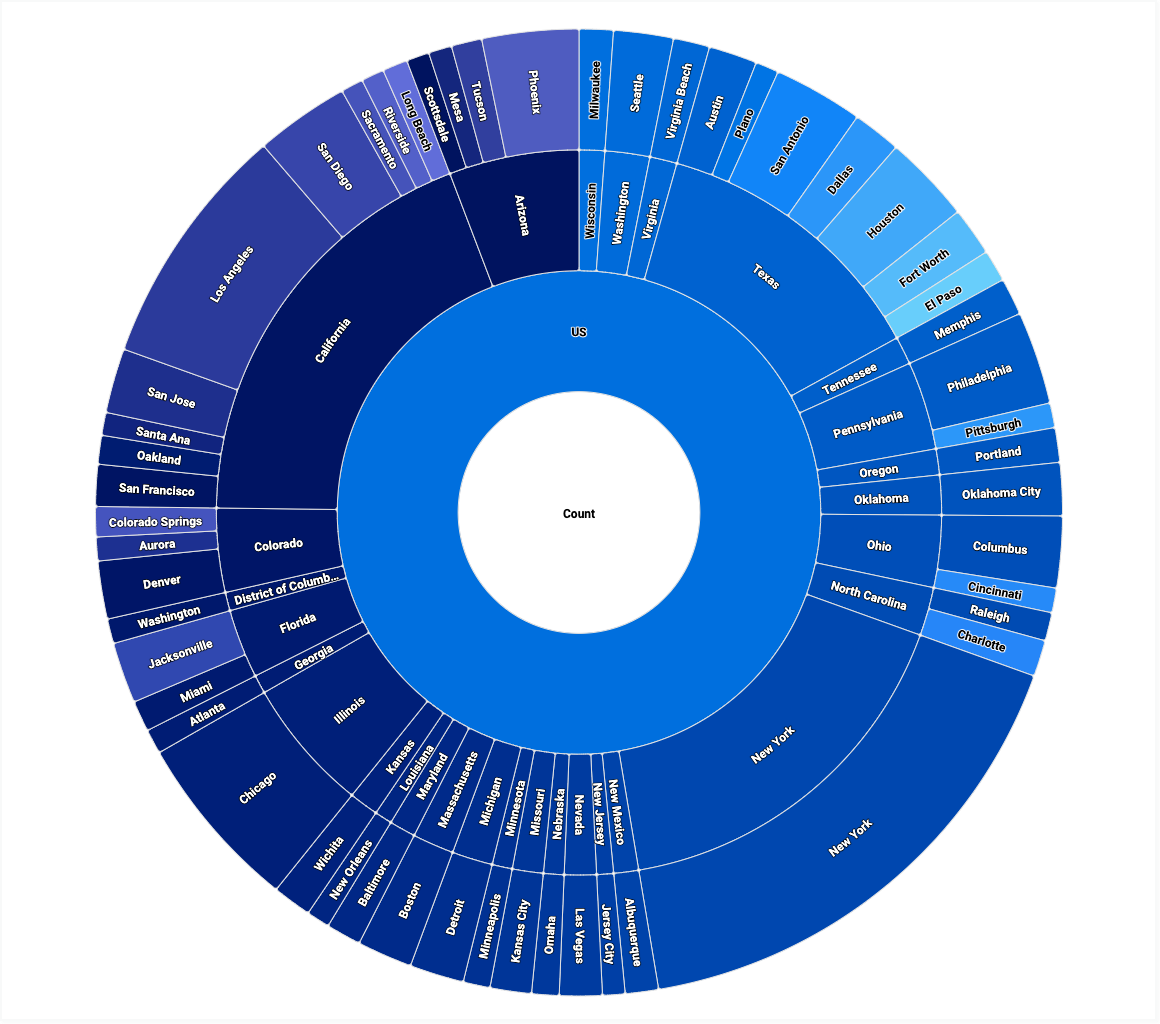
Organizational or Departmental Hierarchies

Reveal how teams and roles nest within larger organizational units.
Product or Category Breakdown


Display how products divide into families, types, and individual items.
Budget or Financial Allocation
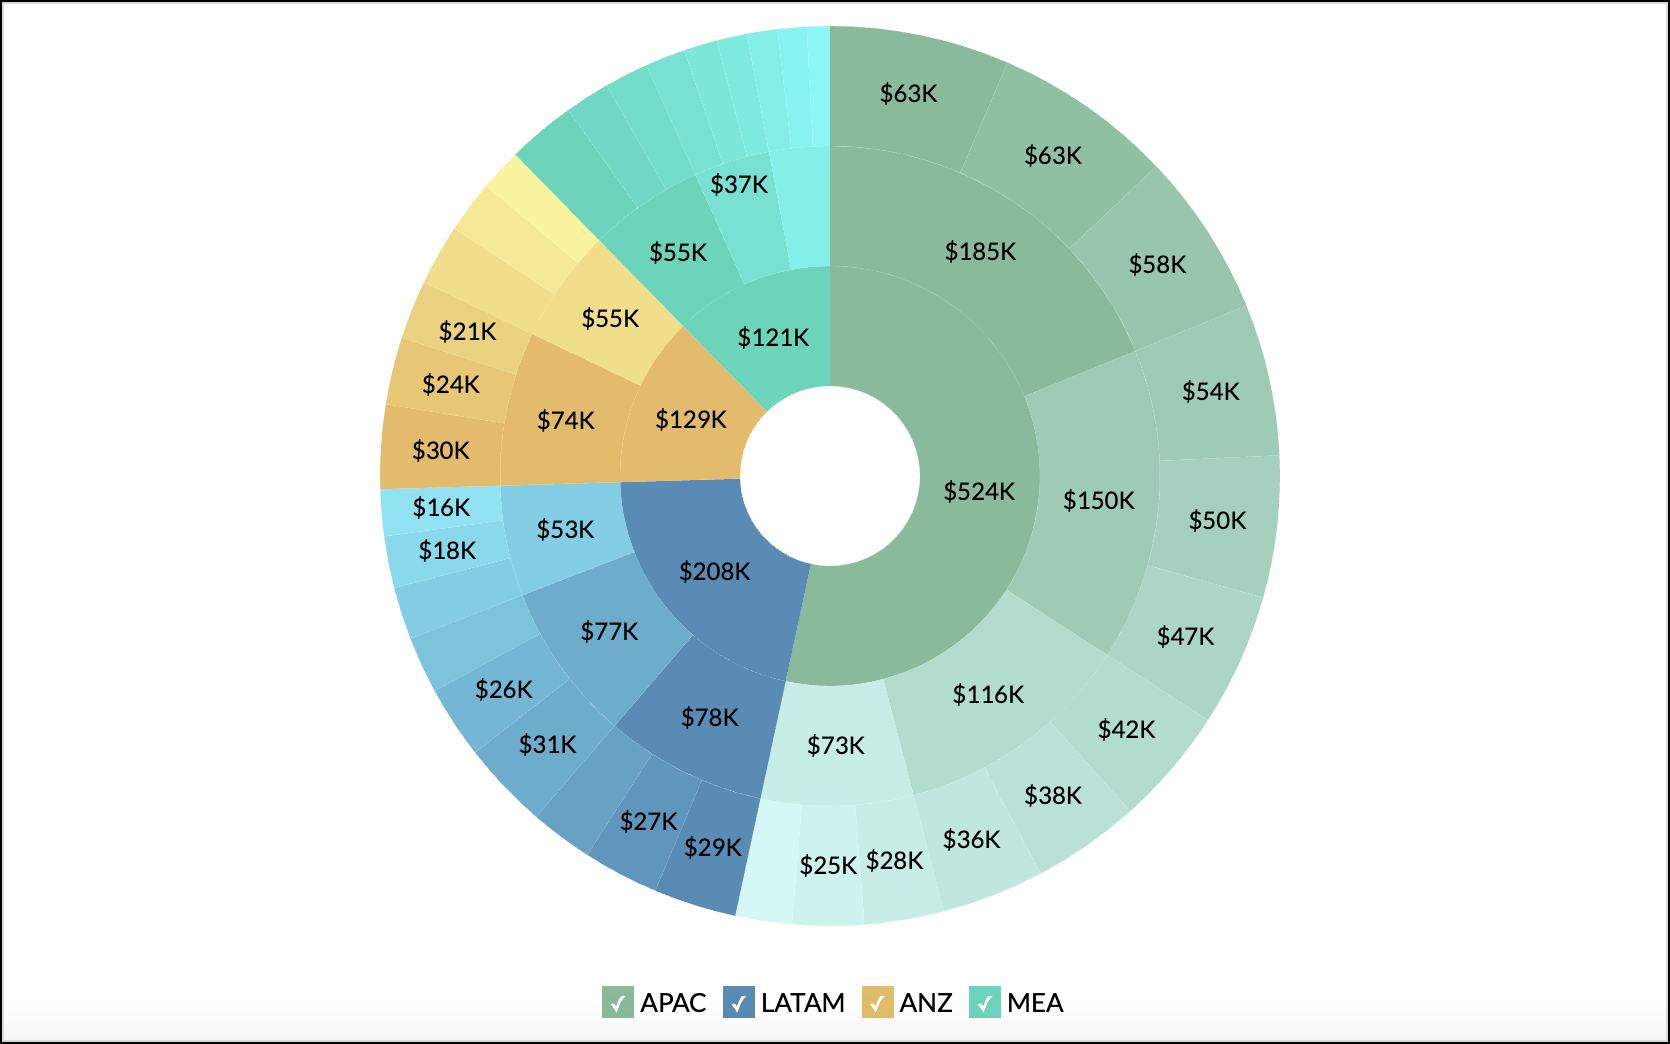
Show how funding distributes across departments, programs, and initiatives.
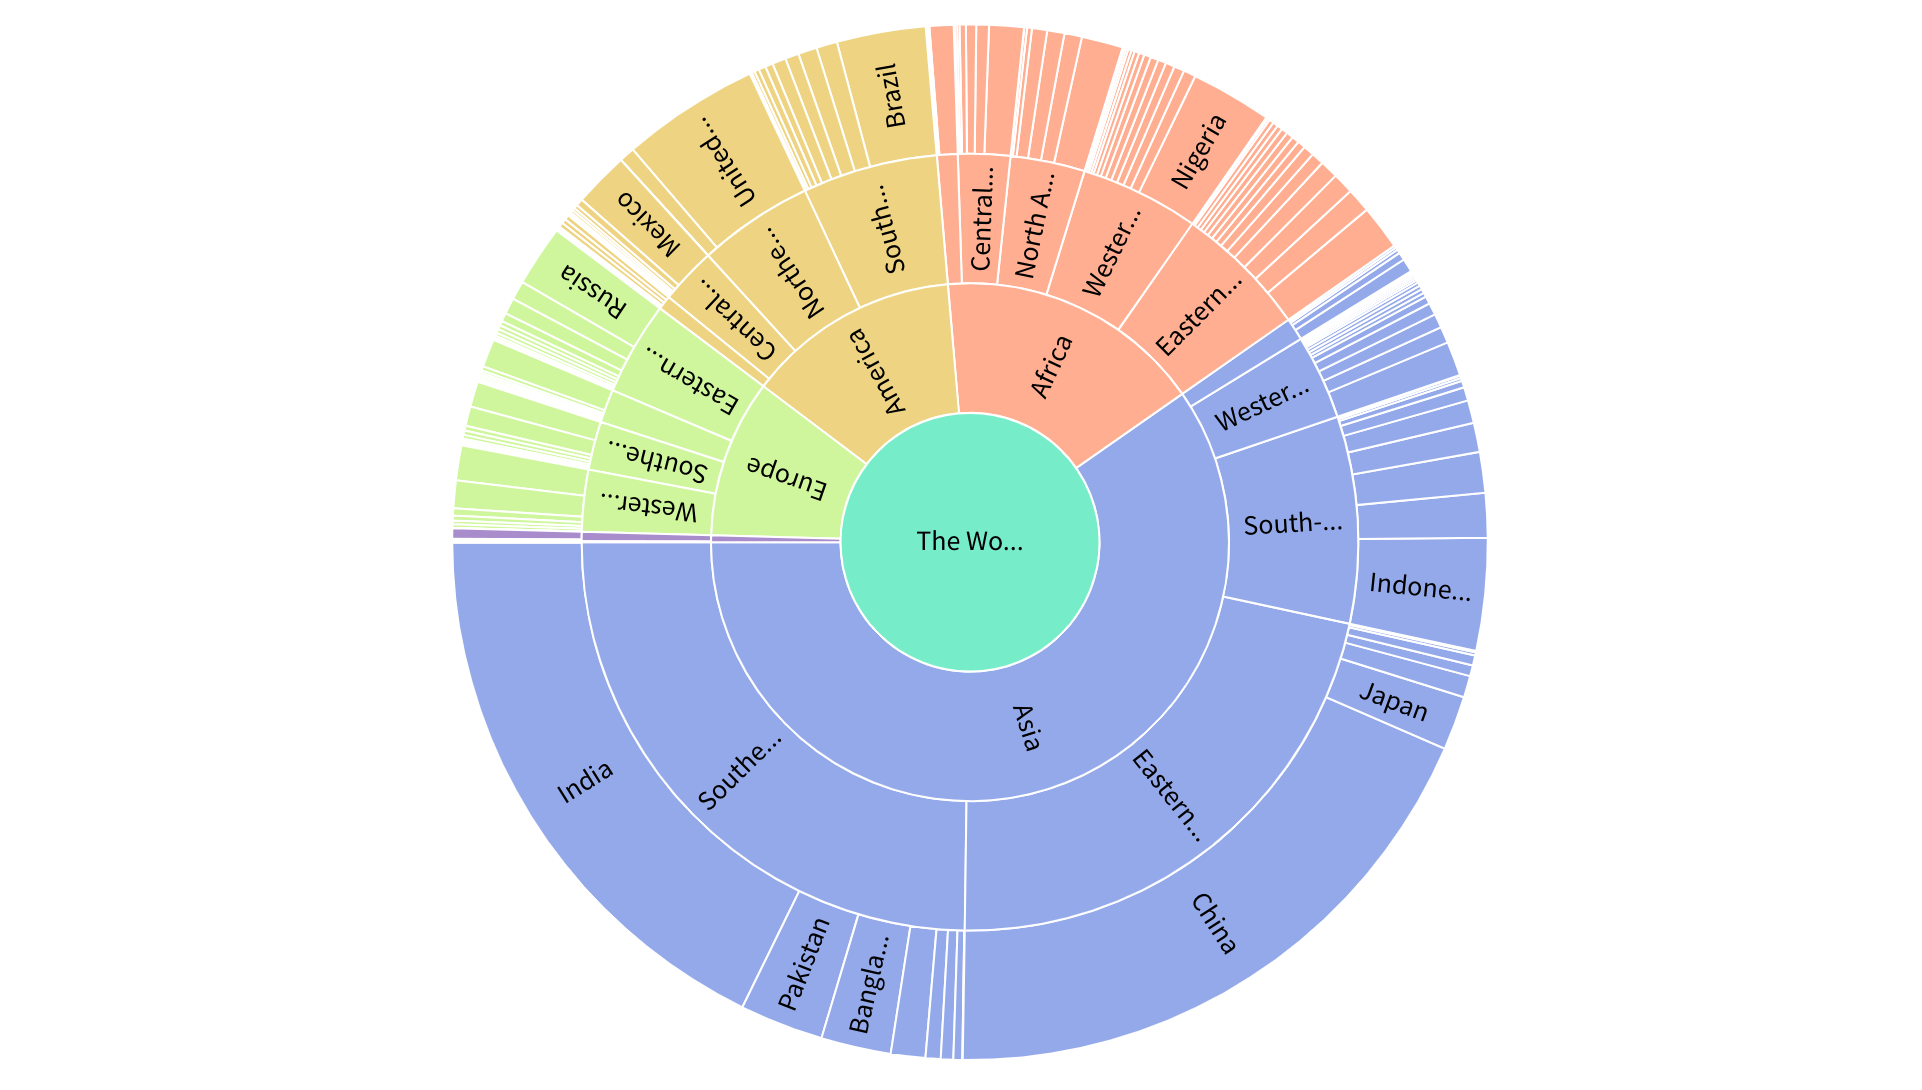
Scientific or Taxonomy Structures


Illustrate hierarchical classification systems in a compact format.
What to Avoid or Be Careful Of with a Sunburst Chart
❌ Don’t include too many hierarchical levels
Deep nesting can make outer rings difficult to read or label.
❌ Don’t rely solely on color differences
Clear labels and spacing help viewers interpret structure more easily.
❌ Don’t use it when comparison between siblings is critical
Bar charts or treemaps often communicate precise differences more clearly.
❌ Don’t overload with small segments
Very thin slices may become unreadable, especially in static formats.
❌ Don’t assume audiences understand the hierarchy instantly
Annotations or interactive features can help guide interpretation.
*Content on this page was curated and edited by expert humans with the creative assistance of AI.