Skip to content
The Comm Spot The Comm Spot

It's All About Communication

  • HOME
  • ABOUT
    • Meet the Creator: Curtis Newbold, PhD
    • Hire Curtis
    • Publish with Us
    • Contact
    • Privacy Notice
  • COMM-BASICS
    • Glossary
    • Citation & Style Guides
      • AP Style (Journalism)
        • AP Style Overview
        • AP Style Guidelines
        • Media Ethics – SPJ Code of Ethics
        • Elements of Newsworthiness
      • APA Style
        • APA Format – Overview
        • APA - References Guidelines
        • APA - In-text Citations
        • APA - Citing Authors
        • APA - Audiovisual Media
        • APA - Books
        • APA - Digital Sources
        • APA - Events & Interactions
        • APA - Periodicals
        • APA - Print Sources (other than books)
      • Chicago Style
        • Chicago – Overview
        • Chicago - Author-Date System
        • Chicago - Notes-Bibliography System
        • Chicago - In-text Citations
        • Chicago Style - Citing Authors
        • Chicago - Audiovisual Media
        • Chicago - Books
        • Chicago - Digital Sources
        • Chicago - Events and Interactions
        • Chicago - Citing Periodicals
        • Chicago - Print Sources (other than books)
      • MLA Style
        • MLA Overview
        • MLA Works Cited Pages
        • MLA In-text Citations
        • MLA – Authors
        • MLA – Audiovisual Media
        • MLA – Books
        • MLA – Digital Sources
        • MLA – Events & Interactions
        • MLA – Periodicals
        • MLA – Print Sources (other than books)
    • Rhetoric
      • Overview of Rhetoric
      • Rhetorical Appeals (Rhetorical Triangle)
      • Branches of Oratory
      • Canons of Rhetoric
      • Rhetorical Devices
      • Kairos
      • Topos
      • Key Figures in Rhetoric
    • Research Methods
      • Case Studies
      • Competitor Analysis
      • Content Analysis
      • Discourse Analysis
      • Ethnography
      • Focus Groups
      • Observation Research
      • S.W.O.T. Analysis
      • Secondary Research
      • Surveys
      • Target Market Analysis
      • Usability Testing
      • Visual Analysis
    • Theories
    • Thinkers
  • COMM-SUBJECTS
    • Interpersonal Communication
      • Active Listening
      • Body Language
      • Conflict Management
      • Emotional Intelligence
        • Emotional Intelligence Overview
        • Self-Awareness
        • Self-Regulation
        • Motivation
        • Empathy
        • Social Skills
        • Emotional Intelligence Resources
      • Feedback
      • Negotiation
        • Overview of Negotiation
        • Negotiation Skills
        • Negotiation Strategies & Techniques
        • Stages of Negotiation
        • Common Negotiation Scenarios
        • Negotiation Case Studies & Examples
        • Negotiation Tools & Resources
        • Negotiation FAQ
    • Journalism
    • Public Speaking
      • General Guidelines
      • Overcoming Fear
      • Speech Writing and Organization
      • Delivery Techniques
      • Body Language
      • Audience Engagement
      • Storytelling
      • Designing Slides
      • P.O.W.E.R.F.U.L. Presentation Method
    • Strategic Communication
      • Business & Org Comm
        • Definition & History
        • Org Comm Theories
        • Business Documents
        • Change Management
        • Employee Relations
        • Employment Communication
        • Group & Team Communication
        • Leadership Communication
        • Power, Identity, & Ethics at Work
        • Project Management
      • Integrated Marketing Comm
        • Definition of IMC
        • Core Principles of IMC
        • IMC Planning
        • Audience Segmentation
        • Marketing Channels
        • Message Strategies
        • Campaign Measurement & Evaluation
        • Trends & Innovations in IMC
        • Challenges & Pitfalls in IMC
        • Careers & Roles in IMC
      • Public Relations
        • Foundations in PR
        • Strategic Practice
        • Tools & Tactics
        • Research & Analysis
        • Professional Development
      • Case Studies in Strat Comm
    • Technical & Scientific Communication
    • Visual Communication
      • Data Visualization
      • Information Design
      • Photography
      • Web Design
    • Written Communication
      • Writing Process
      • Organizational Methods
        • Five Paragraph Essay
        • Hourglass Method of Writing
        • IMRaD Format (Science)
        • Indirect Method (Bad News)
        • Inverted Pyramid (Journalism)
        • Martini Glass
        • Narrative Format
        • Proposal Format
        • Rogerian Method
        • Toulmin Method
      • Plain Language
        • Audience (Plain Language)
        • Organization (Plain Language)
        • Conversation (Plain Language)
        • Simplicity (Plain Language)
        • Word Choice (Plain Language)
        • Sentence Structure (Plain Language)
        • Design (Plain Language)
      • Punctuation
        • Apostrophes
        • Brackets
        • Colons
        • Commas
        • Ellipses
        • Em Dashes
        • En Dashes
        • Exclamation Marks
        • Hyphens
        • Parentheses
        • Periods
        • Question Marks
        • Quotation Marks
        • Semicolons
      • Style
        • Clarity
        • Conciseness
        • Consistency
        • Editing
        • Flow
        • Rhetorical Devices
        • Sentence Structure
        • Storytelling
        • Tone
        • Voice
        • Word Choice
  • RESOURCES
    • Teaching Resources
      • Assignments & Activities
      • Instructional Design
      • Pedagogies
  • BLOGS
    • The Spotlight Blog
    • Comm Sparks
  • SHOP
    • Cart
    • Checkout
0
The Comm Spot
The Comm Spot

It's All About Communication

Bar Chart – Data Visualization

Home >COMM-Subjects >Visual Communication >Data Visualization >Types of Data Visualizations (Charts and Graphs) >Bar Chart – Data Visualization

Bar Chart: How to Compare Values Across Categories

A bar chart is one of the most familiar—and most powerful—ways to compare values across categories. It’s simple, readable, and incredibly versatile, which is exactly why it shows up everywhere from academic research to dashboards to news graphics.

Instead of asking, “How does this change over time?”
you’re asking, “Which categories are bigger, smaller, or different?”


Related Charts and Graphs

Several visuals relate closely to a bar chart and may be better choices depending on the goal, the structure of the data, or the story being told.

  • Grouped bar charts compare multiple subcategories side by side within each main category. Use this variation when several series need to be compared simultaneously without stacking values.
  • Stacked bar charts show how parts contribute to a total within each category. This format works well when composition matters, though precise comparison between middle segments can be more difficult.
  • Horizontal bar charts rotate the traditional layout, making them easier to read when category labels are long or when many items need to be displayed.
  • Lollipop charts provide a lighter visual alternative that reduces visual weight while still allowing comparison through length.
  • Dot plots focus on position instead of bar length, helping reduce clutter when categories are numerous.
  • Column charts are essentially vertical bar charts and are often used interchangeably depending on terminology and design preference.
  • 100% stacked bar charts emphasize proportional relationships rather than absolute values, making them useful when comparing distributions across groups.

What a Bar Chart Is

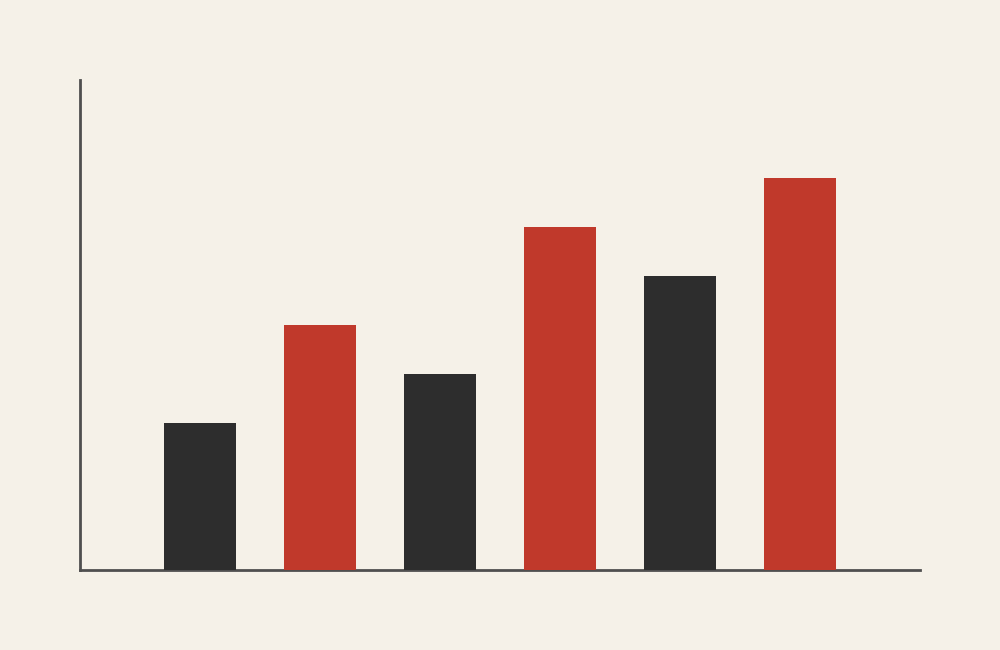
A bar chart displays data using rectangular bars whose lengths represent values. Each bar corresponds to a category, and the bar’s length (or height) shows how much of something that category has.

Bar charts can be:

  • Vertical (columns)
  • Horizontal (bars)
  • Grouped (side-by-side)
  • Stacked (with caution)

At its core, a bar chart is about comparison. It makes differences between categories immediately visible.


When to Use a Bar Chart

Use a bar chart when you want to compare discrete categories clearly and directly.

A bar chart works best when you want to:

  • Compare quantities across categories
  • Rank items from highest to lowest
  • Highlight differences between groups
  • Show frequency or counts
  • Make quick, obvious comparisons

You choose a bar chart when the key question is:

“How do these categories compare to one another?”


Types of Data Sets That Work Best for a Bar Chart

A bar chart works best with categorical data paired with numeric values.

Ideal data sets include:

  • Counts or frequencies
  • Survey responses summarized by category
  • Sales by product or region
  • Budget amounts by department
  • Performance metrics by group
  • Categorical comparisons at a single point in time

Bar charts are especially effective when category labels are meaningful and distinct.


Real-World Examples of a Bar Chart

Bar charts appear everywhere because they’re easy to read and hard to misuse—when used correctly.

Survey Results or Polling Data

https://prod.smassets.net/assets/content/sm/vertical-bar-chart.png

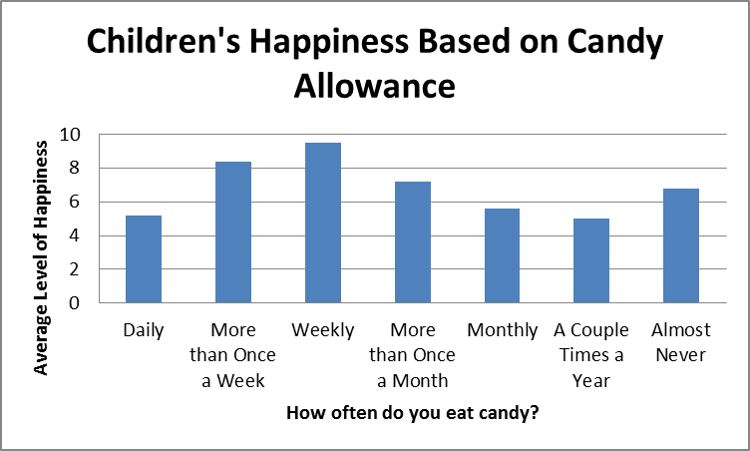
You show how many respondents selected each option, making differences immediately obvious.


Sales, Revenue, or Performance Comparisons

https://www.slideteam.net/media/catalog/product/cache/1280x720/y/e/yearly_product_sales_comparison_with_three_column_bar_graph_slide01.jpg
https://s3.amazonaws.com/thumbnails.venngage.com/template/389a136f-29c3-4b41-b990-69d6ac4bf4c7.png

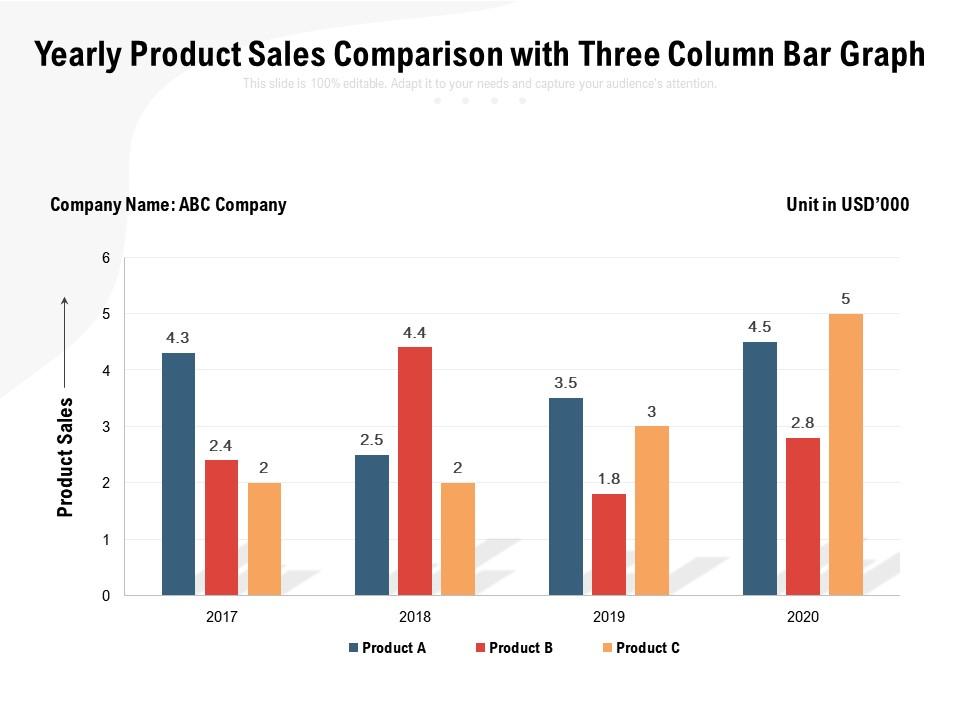
You compare how products, teams, or regions perform relative to one another.


Demographic or Audience Breakdown

https://images.openai.com/static-rsc-3/ymtkYY6JtyqsbThhp4cTbfNEeEhKYqt18v56cFCNLCjSnLgMmPNxg0wYbaS8KkdBmY3hD9vBiGfgoy_2hg3mMMJGPCQ3PZxHYFtUEllYadU?purpose=fullsize&v=1

You show how a population distributes across categories like age, role, or location.


Rankings and Leaderboards

https://www.researchgate.net/publication/273451842/figure/fig5/AS%3A670456239636500%401536860632758/Example-ranked-bar-chart.png
https://blogs.sas.com/content/iml/files/2013/01/TopCategories.png

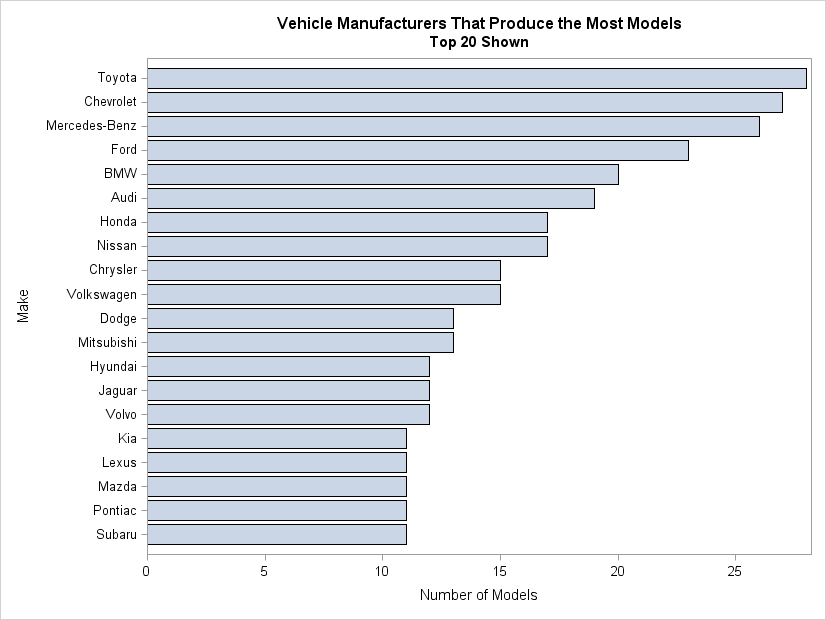
You sort categories to emphasize who’s on top—and who isn’t.


What to Avoid or Be Careful Of with a Bar Chart

❌ Don’t use a bar chart for continuous time trends
If your x-axis is time with many points, a line or area chart will communicate change more clearly.

❌ Don’t truncate the axis
Bar charts rely on a zero baseline. Cutting it off exaggerates differences and misleads viewers.

❌ Don’t overload with categories
Too many bars create clutter. Group or simplify when categories exceed what the eye can comfortably scan.

❌ Don’t stack bars unless necessary
Stacked bars make comparisons difficult unless totals or composition are the primary message.

❌ Don’t ignore sorting
Unsorted bars hide patterns. Ordering bars intentionally often improves clarity and insight.


*Content on this page was curated and edited by expert humans with the creative assistance of AI.

  • facebook
  • instagram
  • linkedin

DON'T MISS ANY SPOT-ON TIPS!

We don't spam! You'll only get emails when we post something awesome.
You can unsubscribe at any time.

Check your inbox or spam folder to confirm your subscription.

©2025 | The Comm Spot | By Newbold Communication & Design