
Visual hierarchy is what tells viewers where to look first, second, and last. In data visualization, it determines whether a chart communicates insight quickly—or forces viewers to work too hard to understand what matters. Strong visual hierarchy guides attention intentionally. Weak hierarchy leaves interpretation up to chance.
This page explains what visual hierarchy is, why it matters in charts and graphs, and how to apply it using clear, practical design choices.
What Is Visual Hierarchy?
Visual hierarchy is the arrangement of visual elements so that their importance is immediately legible. Size, position, color, contrast, spacing, and alignment all work together to signal priority.
In data visualization, hierarchy answers three key questions for the viewer:
- What is the most important data point or pattern?
- What supports that main message?
- What details are available if I look closer?
Without hierarchy, viewers may see all the data—but miss the insight.
Why Visual Hierarchy Matters in Charts and Graphs
Charts are rarely neutral. Every design choice emphasizes something. If hierarchy is not intentional, it becomes accidental—and accidental hierarchy often highlights the wrong thing.
Good hierarchy:
- Reduces cognitive load
- Improves speed of comprehension
- Reinforces the intended takeaway
- Builds trust in the data
Poor hierarchy:
- Forces viewers to hunt for meaning
- Overemphasizes secondary details
- Makes charts feel cluttered or confusing
- Undermines credibility
Establishing Hierarchy Through Size
Size is one of the fastest ways viewers interpret importance.
Do:
- Make the most important data series slightly thicker or larger
- Use larger text for titles and key annotations
- Scale markers or labels to reflect importance, not uniformity
Don’t:
- Use the same size for every visual element
- Oversize axes, gridlines, or legends
- Make labels larger than the data they explain
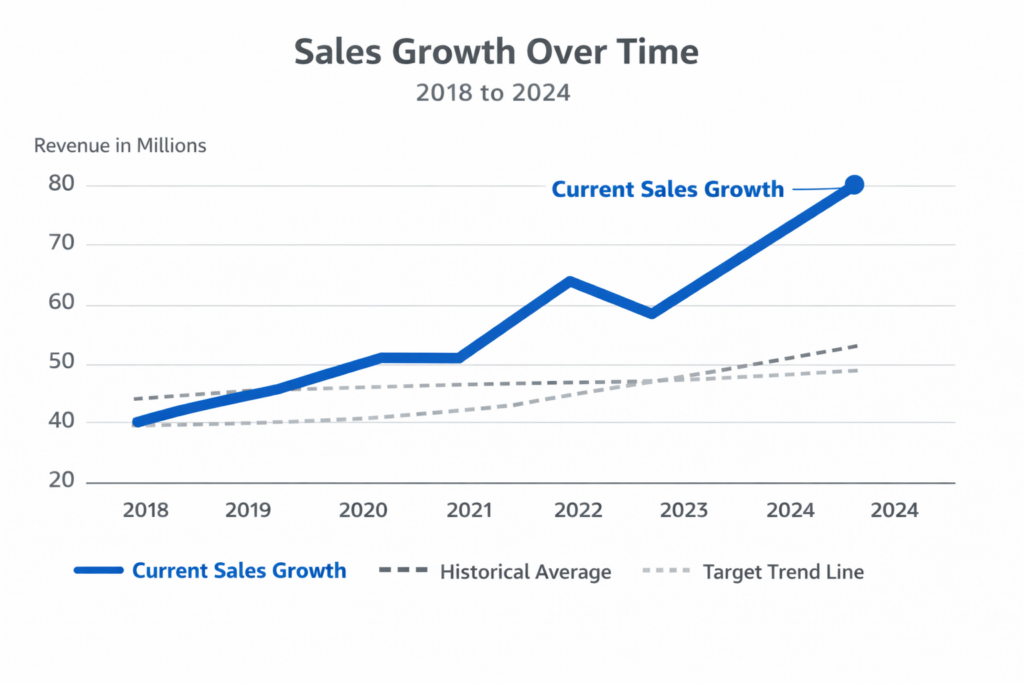
Example:
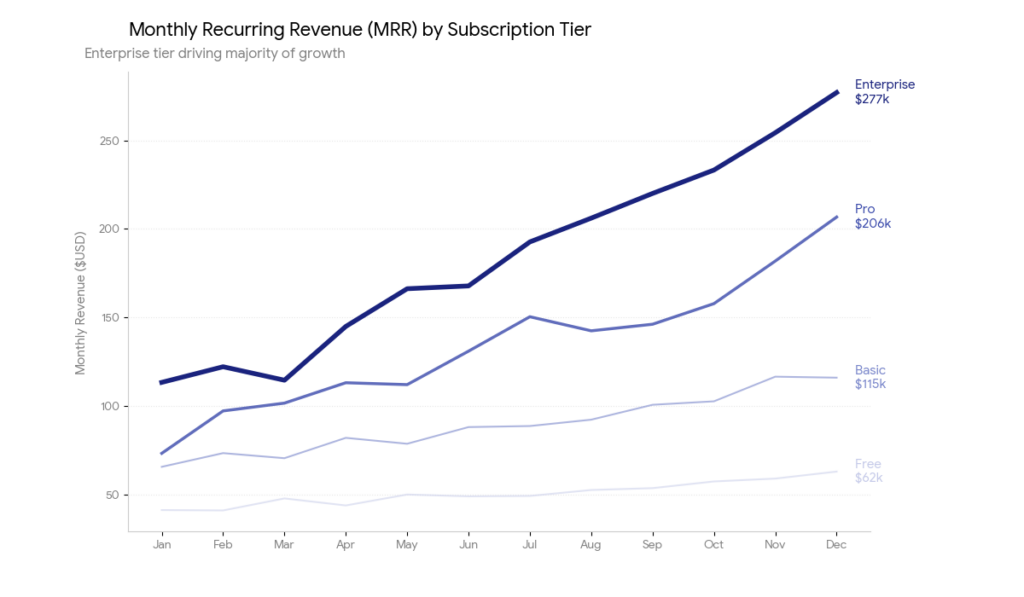
In a line chart showing sales growth, the main trend line should be visually stronger than reference lines or historical averages.
Using Color to Signal Importance (Not Decoration)
Color should encode meaning, not add visual noise.
Do:
- Use one strong color to highlight the primary data series
- Use muted or neutral colors for secondary data
- Keep color usage consistent across related charts
Don’t:
- Use multiple bright colors with equal emphasis
- Color everything differently without meaning
- Rely on color alone to convey critical distinctions
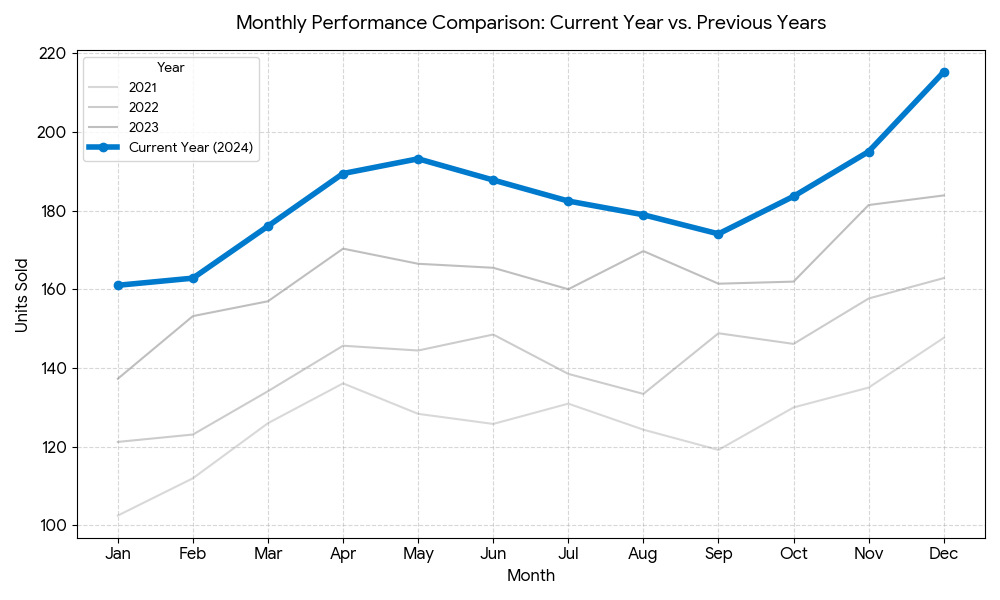
Example:
Highlight the current year in color while showing previous years in gray.
Creating Hierarchy with Contrast
Contrast directs attention by making differences obvious.
Do:
- Increase contrast for key data points or categories
- Use darker tones for foreground elements
- Use lighter tones for background structure
Don’t:
- Use high contrast everywhere
- Allow gridlines or borders to compete with data
- Place low-contrast text on complex backgrounds
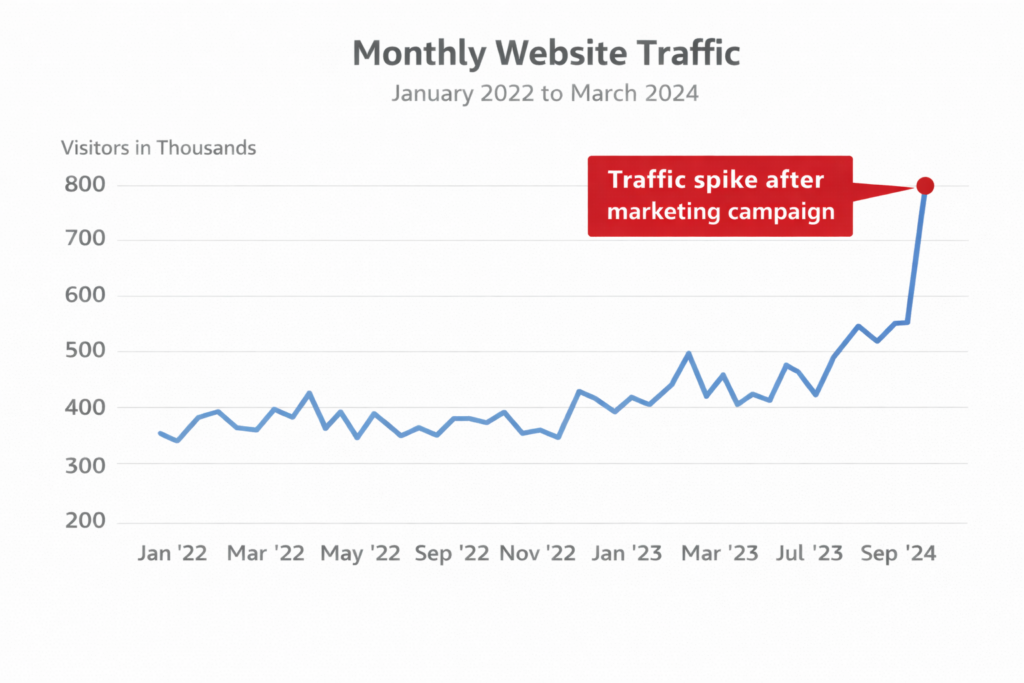
Example:
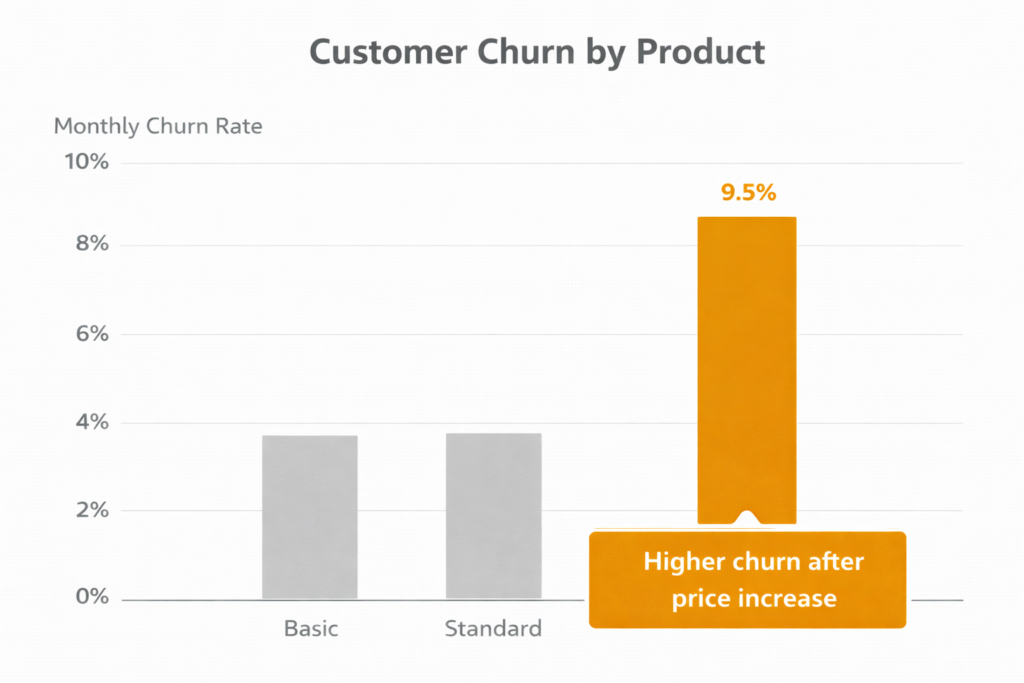
A bold annotation with high contrast draws attention to an outlier without overwhelming the chart.
Managing Hierarchy with Position and Layout
Where elements appear matters as much as how they look.
Do:
- Place the most important information near the top or left
- Align labels close to the data they describe
- Group related elements spatially
Don’t:
- Scatter related elements across the chart
- Force viewers to jump back and forth between legend and data
- Bury key takeaways below secondary information
Example:
Directly label lines instead of relying on a distant legend.
Hierarchy Through White Space
White space is not empty—it is organizational.
Do:
- Use spacing to separate major sections
- Give important elements room to breathe
- Use margins to create focus
Don’t:
- Pack charts edge to edge
- Fill every available space with content
- Treat white space as wasted space
Example:
Extra spacing around a key bar or annotation increases its perceived importance.
Text Hierarchy: Titles, Labels, and Annotations
Text often carries the message—hierarchy ensures it’s readable.
Do:
- Write titles that state the takeaway, not just the topic
- Use larger or bolder text for the main message
- Keep axis labels smaller and secondary
Don’t:
- Use identical text styles for all labels
- Write generic titles (“Sales by Year”)
- Over-annotate with equal emphasis
Example:
Title: Customer Churn Spiked After Pricing Changes
Subtitle: Monthly churn rate, 2022–2024
Hierarchy in Multi-Series and Complex Charts
As complexity increases, hierarchy becomes more important.
Do:
- Clearly distinguish the primary series
- Reduce visual weight of secondary data
- Consider splitting charts if hierarchy becomes unclear
Don’t:
- Treat all series as equally important
- Overload charts with too many comparisons
- Expect viewers to infer importance on their own
Example:
In a multi-line chart, highlight one line and mute the rest.
A Simple Hierarchy Checklist
Before finalizing a chart, ask:
- What should viewers notice first?
- What supports that main insight?
- What can be de-emphasized or removed?
If everything feels equally loud, hierarchy needs work.
Key Takeaway
Visual hierarchy is not about making charts look fancy—it’s about making meaning visible. When hierarchy is intentional, viewers understand faster, remember more, and trust the data. When hierarchy is ignored, even accurate charts fail to communicate insight.
Strong data visualization doesn’t show everything equally.
It shows what matters most, first.
*Content on this page was curated and edited by expert humans with the creative assistance of AI.