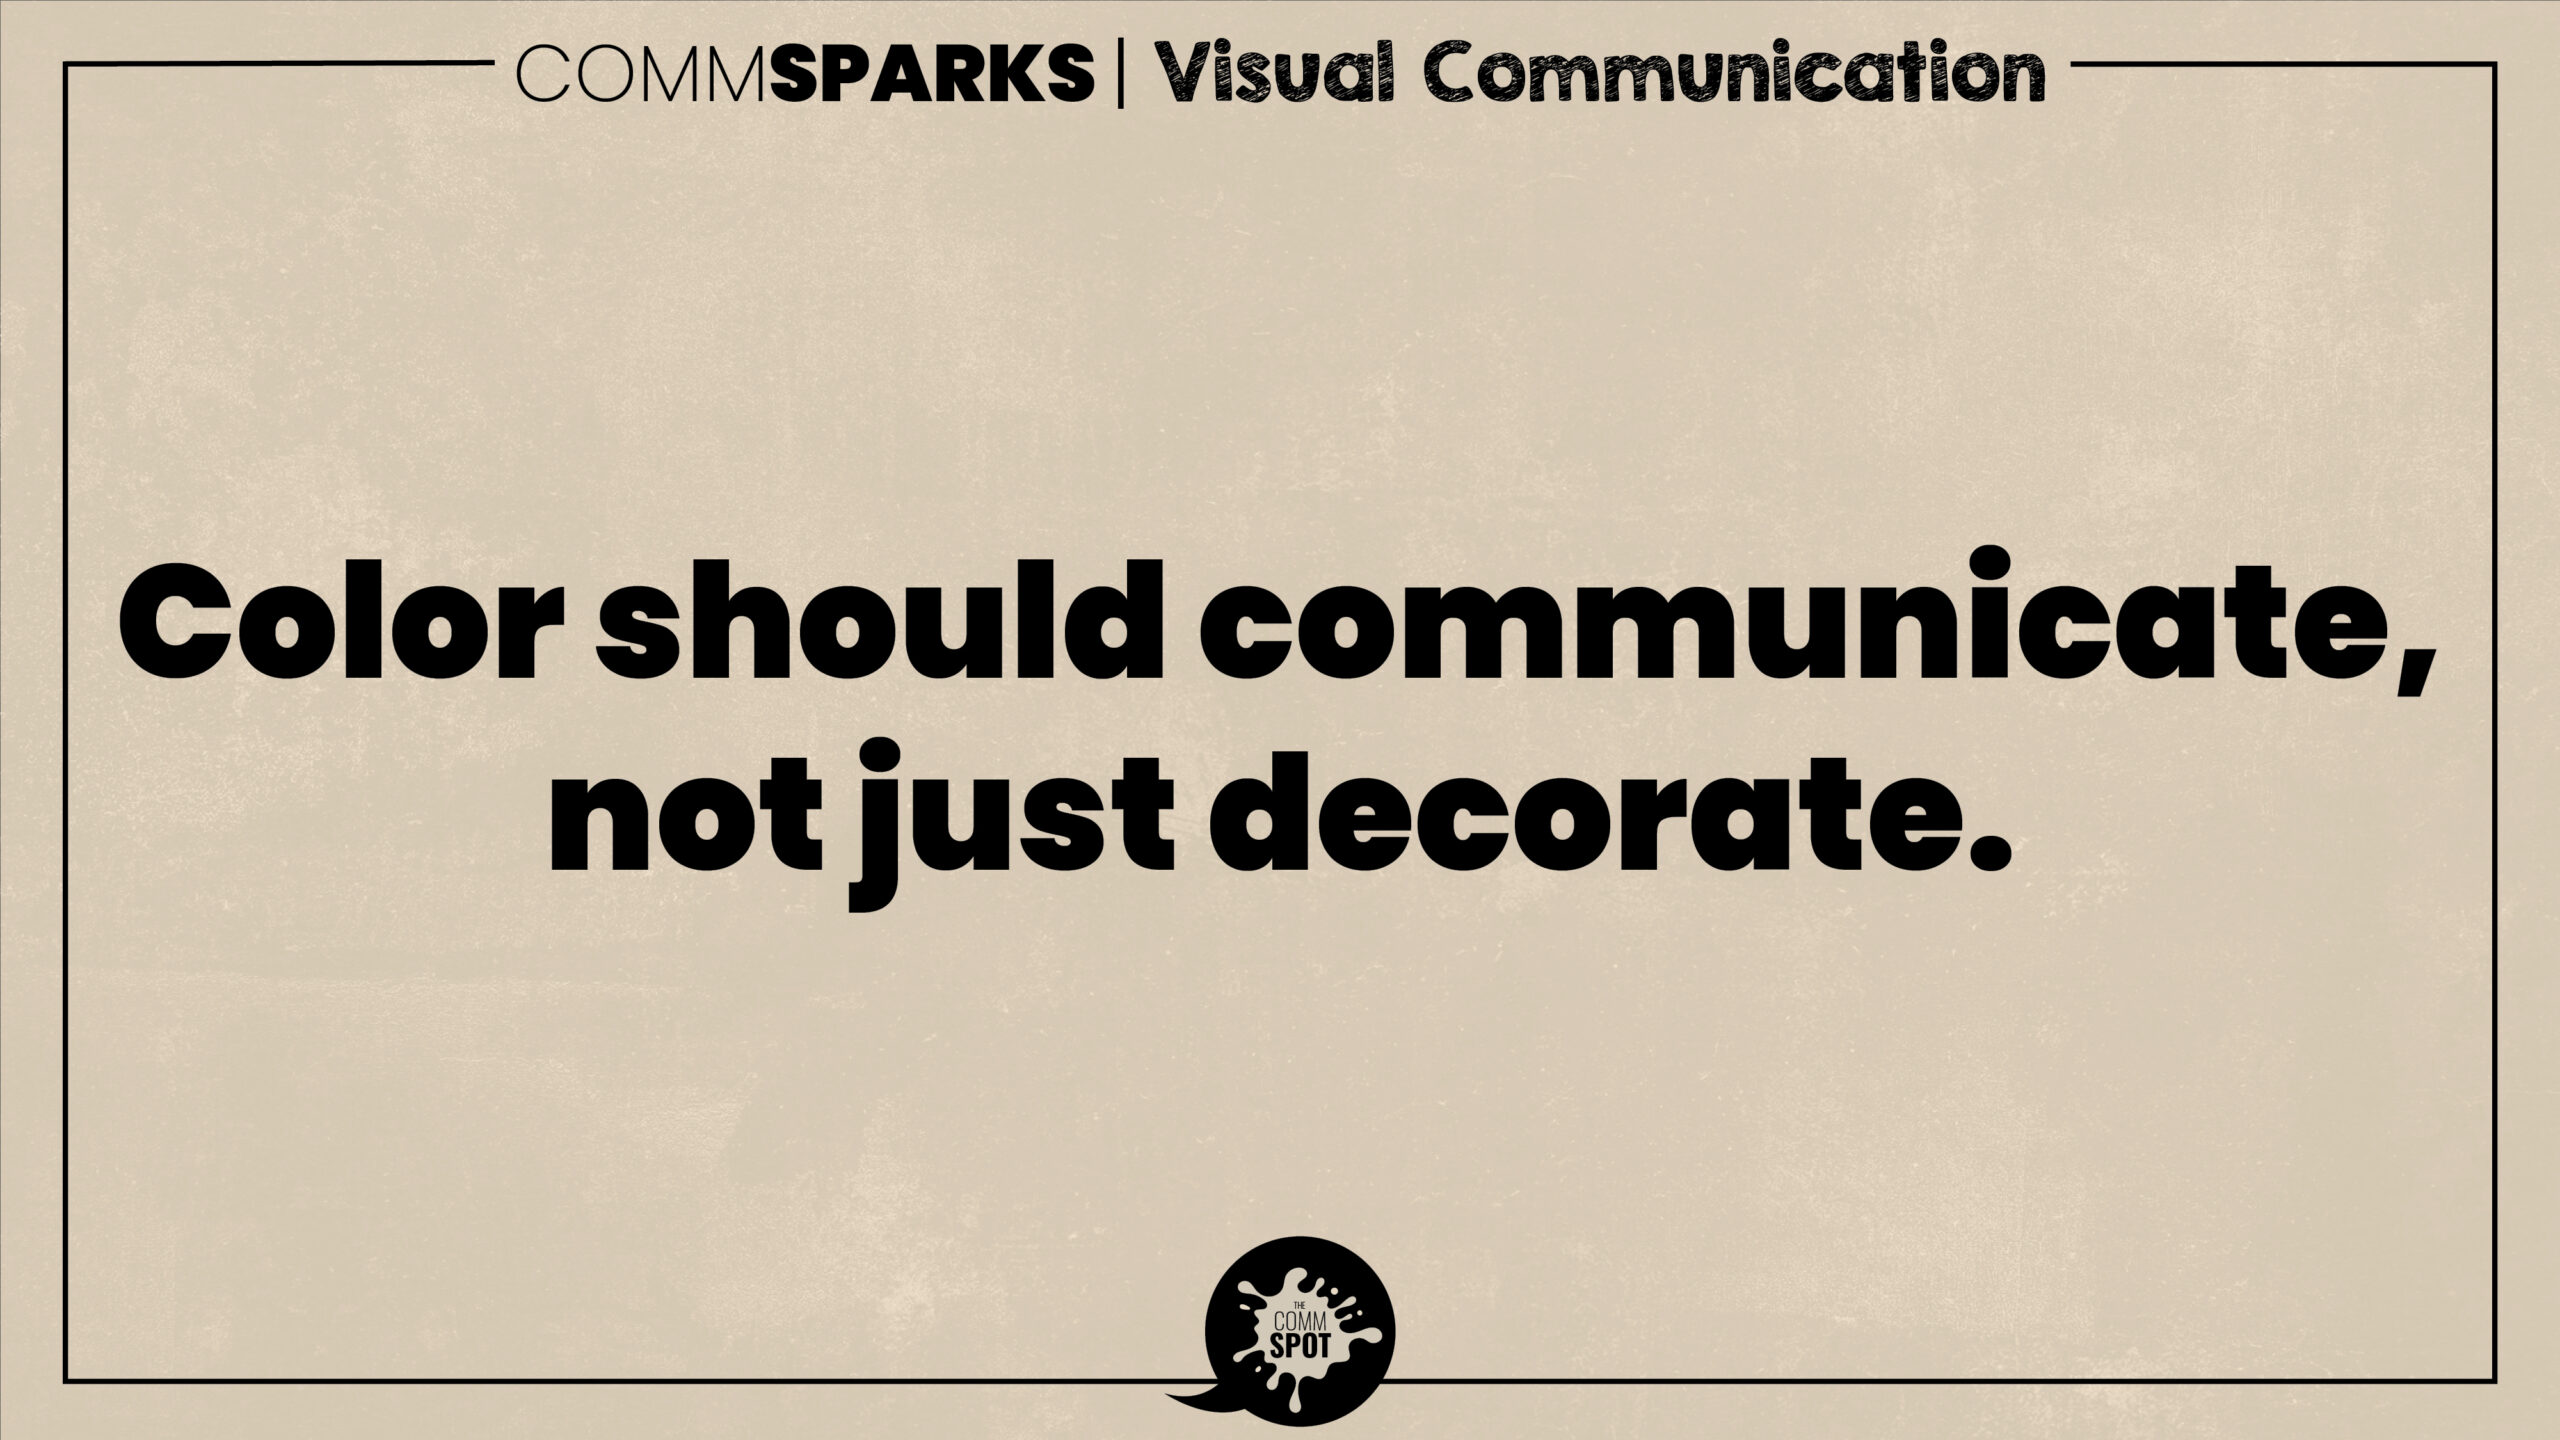
Color is a meaning system, not a finishing touch. It signals hierarchy (what matters first), category (what belongs together), status (good/bad, high/low), and emotion (calm/urgent). When color is applied decoratively—chosen because it “looks nice” rather than because it encodes meaning—it adds noise and increases cognitive load. Viewers spend effort interpreting color choices that don’t correspond to anything. Worse, decorative color can mislead by implying distinctions that aren’t real.
Strategic color use begins with purpose. If color is used to differentiate categories, those categories must remain consistent across the document or deck. If color signals status (risk, progress, warning), the meaning should be intuitive and stable. Limiting a palette increases clarity: a few disciplined colors create stronger signals than many competing hues. Color should also be accessible. Poor contrast and color-only distinctions can exclude readers with color-vision differences or those viewing on low-quality screens.
In data visualization, color is especially powerful—and dangerous. It can highlight patterns, but it can also exaggerate or obscure them. Responsible color use makes interpretation easier, not louder. The best color decisions are the ones that feel inevitable: they guide understanding without calling attention to themselves.
Try it!
- Assign colors to categories and keep them consistent across every chart and page.
- Use color sparingly—only where it clarifies hierarchy or meaning.
- Check contrast and avoid relying on color alone to convey differences.