Skip to content
The Comm Spot The Comm Spot

It's All About Communication

  • HOME
  • ABOUT
    • Meet the Creator: Curtis Newbold, PhD
    • Hire Curtis
    • Publish with Us
    • Contact
    • Privacy Notice
  • COMM-BASICS
    • Glossary
    • Citation & Style Guides
      • AP Style (Journalism)
        • AP Style Overview
        • AP Style Guidelines
        • Media Ethics – SPJ Code of Ethics
        • Elements of Newsworthiness
      • APA Style
        • APA Format – Overview
        • APA - References Guidelines
        • APA - In-text Citations
        • APA - Citing Authors
        • APA - Audiovisual Media
        • APA - Books
        • APA - Digital Sources
        • APA - Events & Interactions
        • APA - Periodicals
        • APA - Print Sources (other than books)
      • Chicago Style
        • Chicago – Overview
        • Chicago - Author-Date System
        • Chicago - Notes-Bibliography System
        • Chicago - In-text Citations
        • Chicago Style - Citing Authors
        • Chicago - Audiovisual Media
        • Chicago - Books
        • Chicago - Digital Sources
        • Chicago - Events and Interactions
        • Chicago - Citing Periodicals
        • Chicago - Print Sources (other than books)
      • MLA Style
        • MLA Overview
        • MLA Works Cited Pages
        • MLA In-text Citations
        • MLA – Authors
        • MLA – Audiovisual Media
        • MLA – Books
        • MLA – Digital Sources
        • MLA – Events & Interactions
        • MLA – Periodicals
        • MLA – Print Sources (other than books)
    • Rhetoric
      • Overview of Rhetoric
      • Rhetorical Appeals (Rhetorical Triangle)
      • Branches of Oratory
      • Canons of Rhetoric
      • Rhetorical Devices
      • Kairos
      • Topos
      • Key Figures in Rhetoric
    • Research Methods
      • Case Studies
      • Competitor Analysis
      • Content Analysis
      • Discourse Analysis
      • Ethnography
      • Focus Groups
      • Observation Research
      • S.W.O.T. Analysis
      • Secondary Research
      • Surveys
      • Target Market Analysis
      • Usability Testing
      • Visual Analysis
    • Theories
    • Thinkers
  • COMM-SUBJECTS
    • Interpersonal Communication
      • Active Listening
      • Body Language
      • Conflict Management
      • Emotional Intelligence
        • Emotional Intelligence Overview
        • Self-Awareness
        • Self-Regulation
        • Motivation
        • Empathy
        • Social Skills
        • Emotional Intelligence Resources
      • Feedback
      • Negotiation
        • Overview of Negotiation
        • Negotiation Skills
        • Negotiation Strategies & Techniques
        • Stages of Negotiation
        • Common Negotiation Scenarios
        • Negotiation Case Studies & Examples
        • Negotiation Tools & Resources
        • Negotiation FAQ
    • Journalism
    • Public Speaking
      • General Guidelines
      • Overcoming Fear
      • Speech Writing and Organization
      • Delivery Techniques
      • Body Language
      • Audience Engagement
      • Storytelling
      • Designing Slides
      • P.O.W.E.R.F.U.L. Presentation Method
    • Strategic Communication
      • Business & Org Comm
        • Definition & History
        • Org Comm Theories
        • Business Documents
        • Change Management
        • Employee Relations
        • Employment Communication
        • Group & Team Communication
        • Leadership Communication
        • Power, Identity, & Ethics at Work
        • Project Management
      • Integrated Marketing Comm
        • Definition of IMC
        • Core Principles of IMC
        • IMC Planning
        • Audience Segmentation
        • Marketing Channels
        • Message Strategies
        • Campaign Measurement & Evaluation
        • Trends & Innovations in IMC
        • Challenges & Pitfalls in IMC
        • Careers & Roles in IMC
      • Public Relations
        • Foundations in PR
        • Strategic Practice
        • Tools & Tactics
        • Research & Analysis
        • Professional Development
      • Case Studies in Strat Comm
    • Technical & Scientific Communication
    • Visual Communication
      • Data Visualization
      • Information Design
      • Photography
      • Web Design
    • Written Communication
      • Writing Process
      • Organizational Methods
        • Five Paragraph Essay
        • Hourglass Method of Writing
        • IMRaD Format (Science)
        • Indirect Method (Bad News)
        • Inverted Pyramid (Journalism)
        • Martini Glass
        • Narrative Format
        • Proposal Format
        • Rogerian Method
        • Toulmin Method
      • Plain Language
        • Audience (Plain Language)
        • Organization (Plain Language)
        • Conversation (Plain Language)
        • Simplicity (Plain Language)
        • Word Choice (Plain Language)
        • Sentence Structure (Plain Language)
        • Design (Plain Language)
      • Punctuation
        • Apostrophes
        • Brackets
        • Colons
        • Commas
        • Ellipses
        • Em Dashes
        • En Dashes
        • Exclamation Marks
        • Hyphens
        • Parentheses
        • Periods
        • Question Marks
        • Quotation Marks
        • Semicolons
      • Style
        • Clarity
        • Conciseness
        • Consistency
        • Editing
        • Flow
        • Rhetorical Devices
        • Sentence Structure
        • Storytelling
        • Tone
        • Voice
        • Word Choice
  • RESOURCES
    • Teaching Resources
      • Assignments & Activities
      • Instructional Design
      • Pedagogies
  • BLOGS
    • The Spotlight Blog
    • Comm Sparks
  • SHOP
    • Cart
    • Checkout
0
The Comm Spot
The Comm Spot

It's All About Communication

Flowchart – Data Visualization

Home >COMM-Subjects >Visual Communication >Data Visualization >Types of Data Visualizations (Charts and Graphs) >Flowchart – Data Visualization

Flowchart: How to Show Processes, Decisions, and Sequences

A flowchart helps visualize how a process unfolds from start to finish. Use it to map steps, decisions, and pathways so complex systems become easier to understand at a glance.

Turn to a flowchart when structure and sequence matter. Rather than describing a process in paragraphs, this visual shows how actions connect, where decisions occur, and how outcomes branch or converge.


What a Flowchart Is

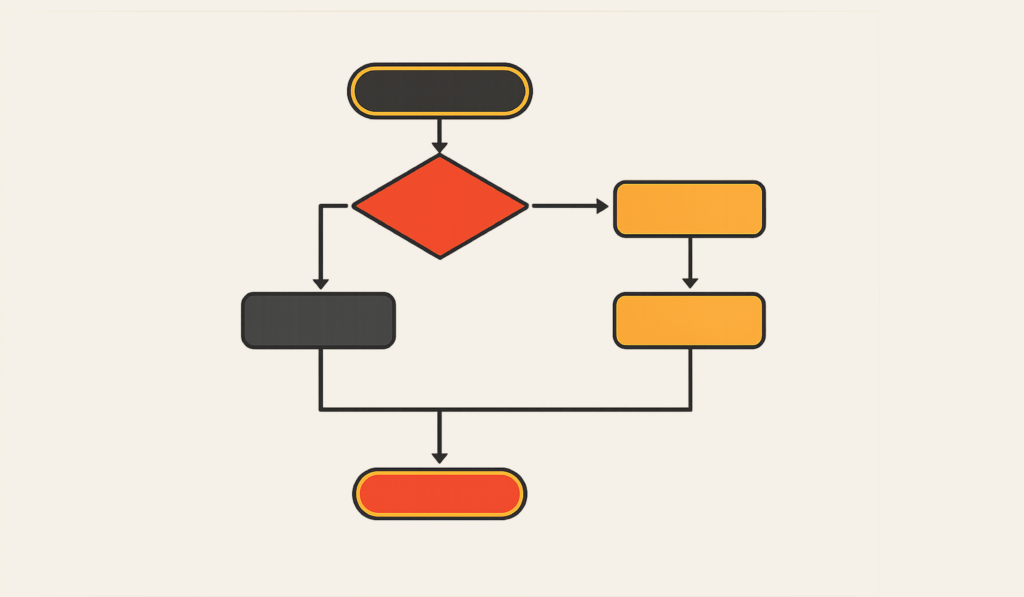
A flowchart is a diagram that represents a process using shapes connected by lines or arrows. Each shape communicates a specific function, helping viewers follow the logic step by step.

Common elements include:

  • Rectangles for actions or tasks
  • Diamonds for decisions or branching points
  • Arrows showing direction and sequence
  • Start and end points that frame the process

Flowcharts emphasize logic and progression, making them especially useful for explaining systems that involve multiple steps or conditions.


When to Use a Flowchart

Use a flowchart when clarity around sequence or decision-making is essential.

This visual works especially well when the goal is to:

  • Explain workflows or procedures
  • Map decision trees
  • Outline onboarding or training steps
  • Document processes for consistency
  • Troubleshoot or diagnose problems
  • Teach complex systems in a simplified way

A flowchart works best when the purpose is to show how actions lead to outcomes.


Types of Data Sets That Work Best for a Flowchart

Flowcharts work best with structured processes rather than numerical datasets.

Strong candidates include:

  • Operational workflows
  • Customer or user journeys
  • Troubleshooting guides
  • Approval or review processes
  • Instructional or training pathways
  • Algorithms or logical sequences

Each step should connect logically to the next, forming a clear progression from beginning to end.


Real-World Examples of a Flowchart

Flowcharts appear in business, education, engineering, healthcare, and design whenever processes need to be clarified.

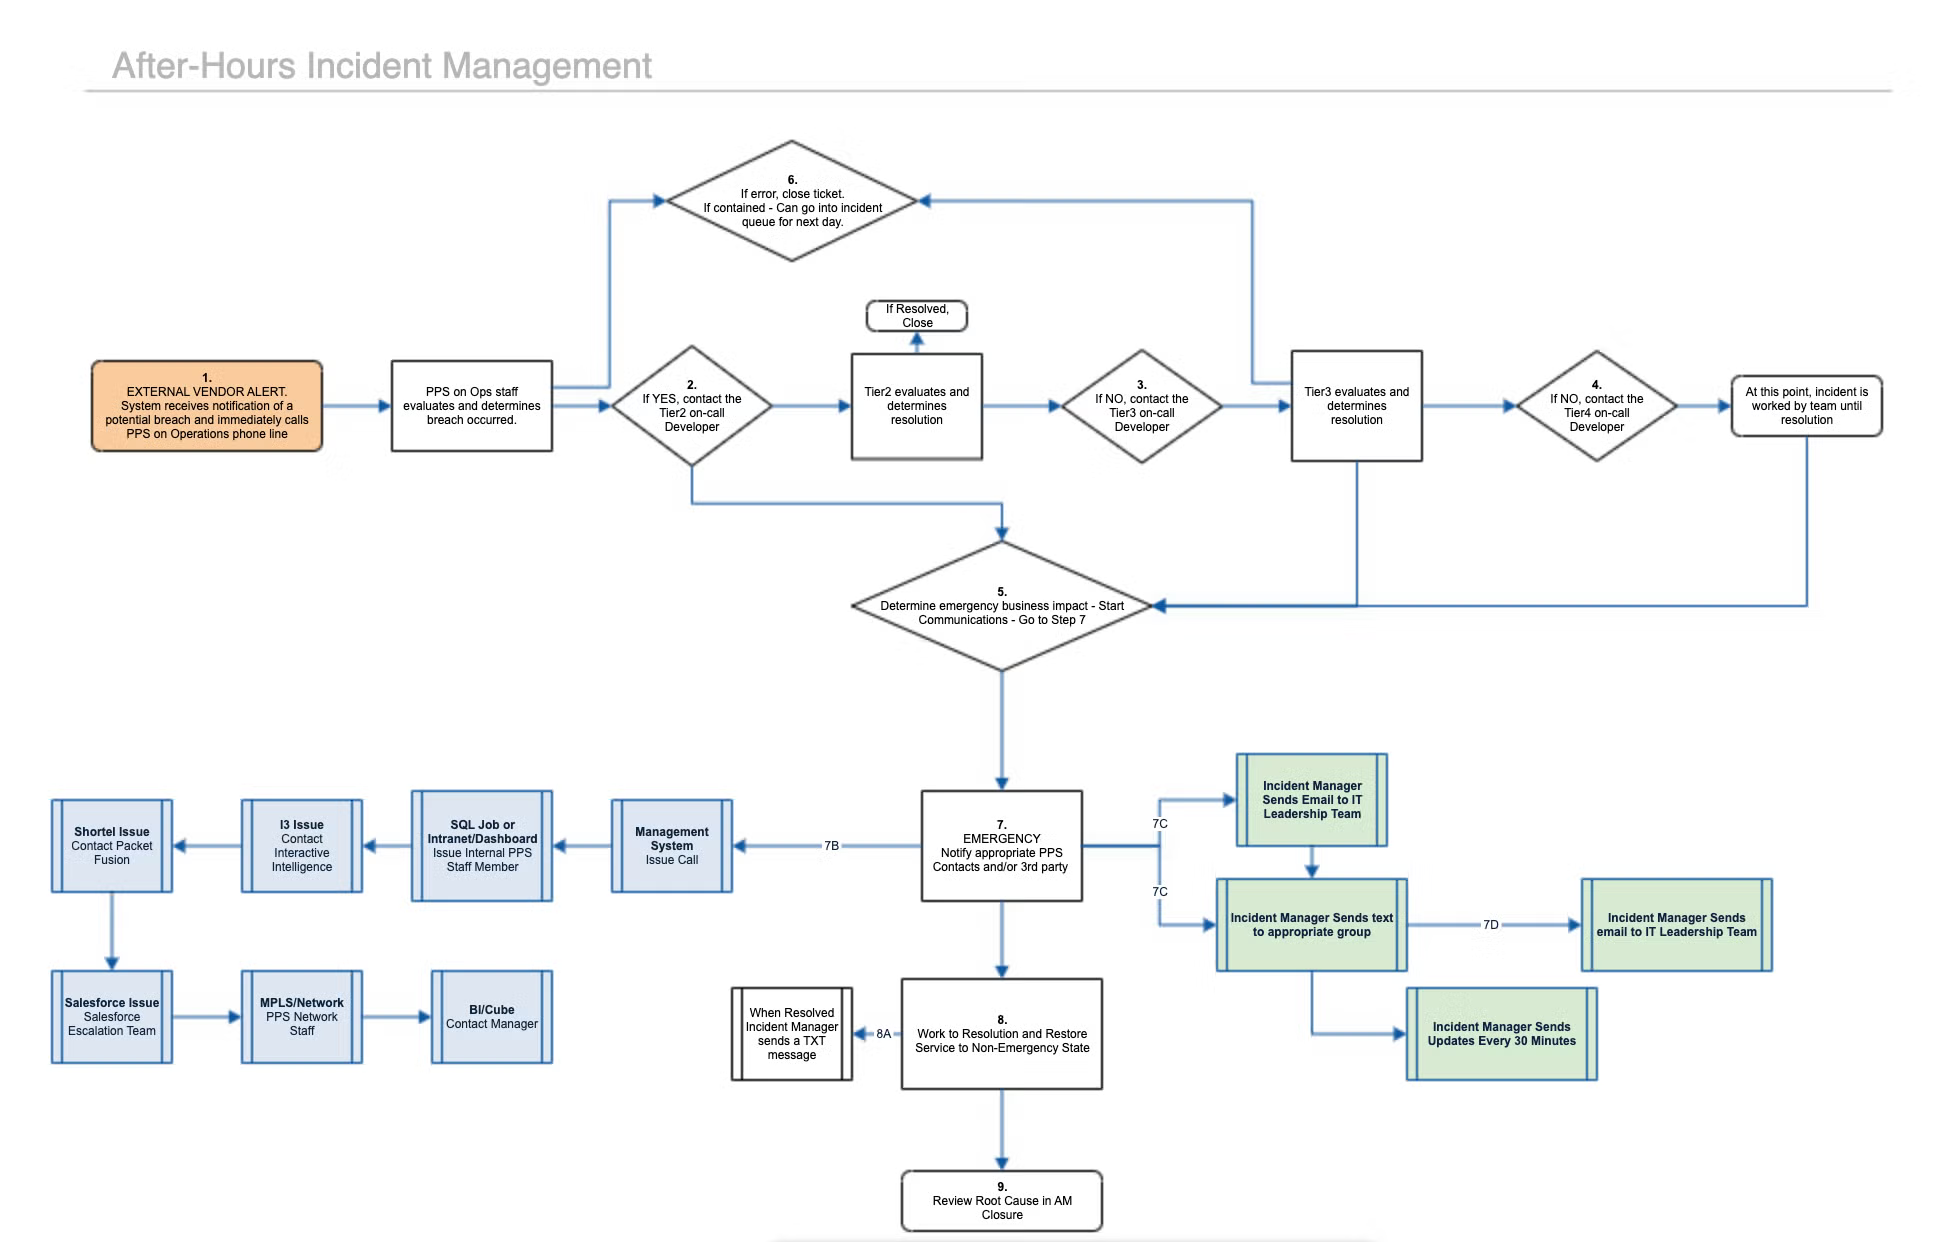
Customer Support or Troubleshooting Paths

Example flow chart
Example flow chart
Example flow chart

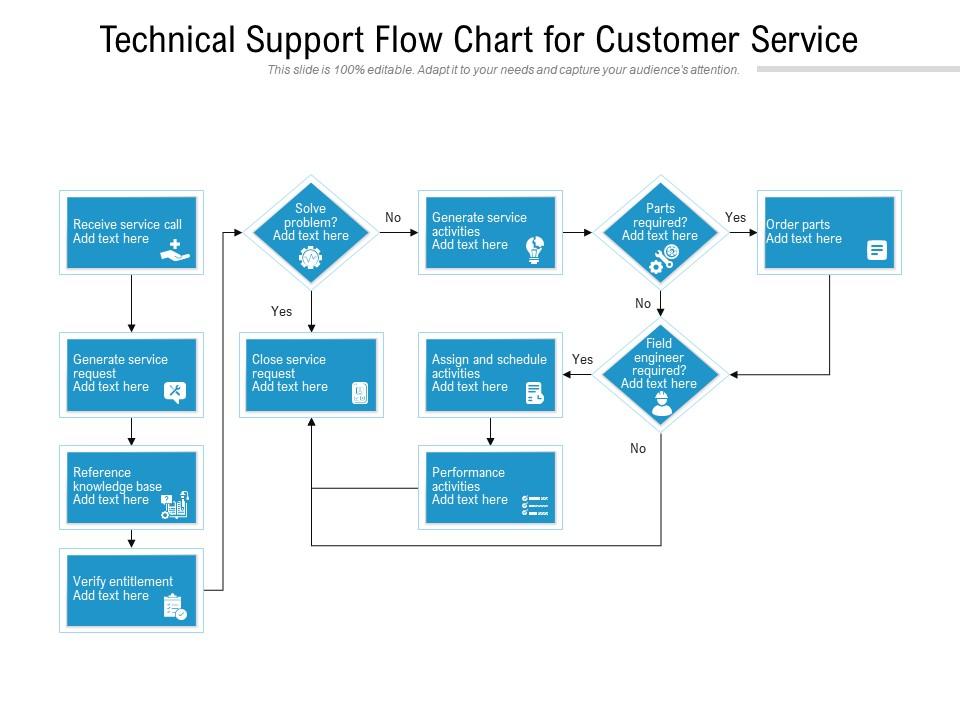
Guide users through questions and decisions that lead to solutions.


Business or Operational Workflows

Example flow chart
Example flow chart

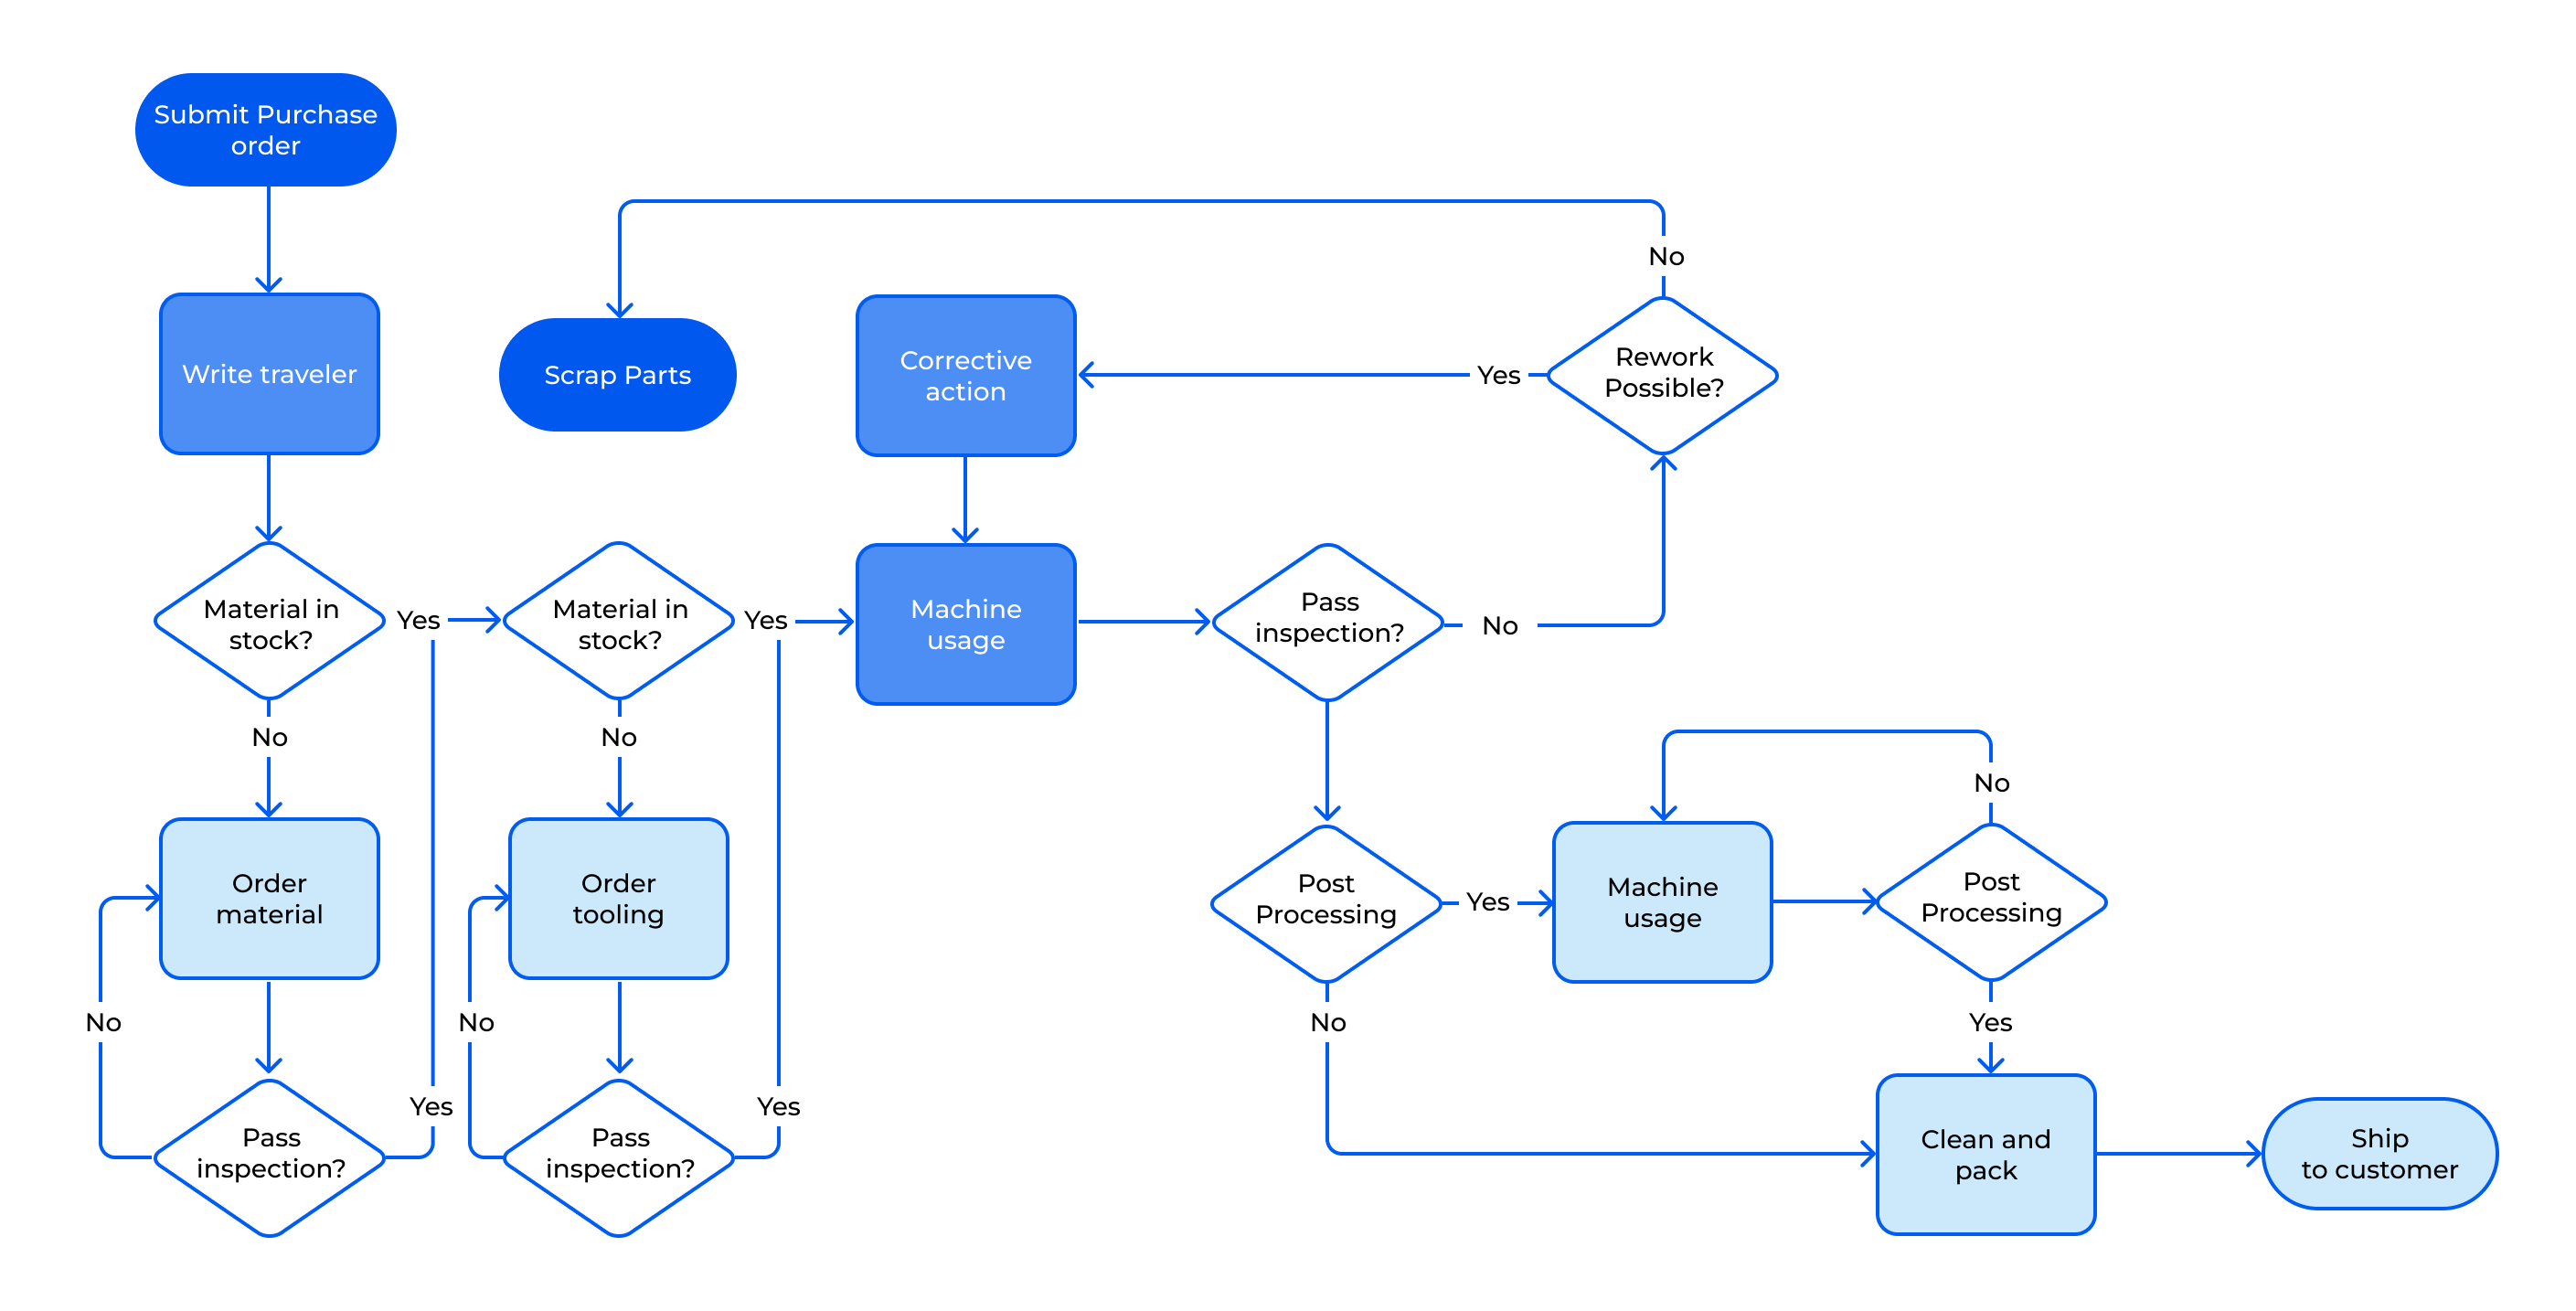
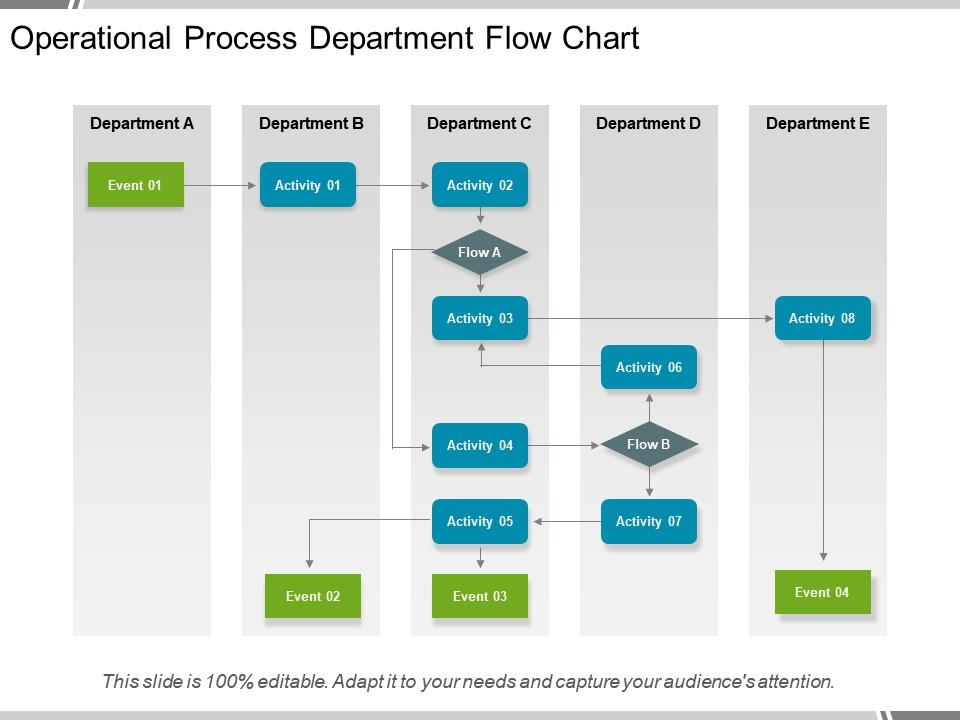
Map how tasks move between teams or stages within an organization.


Onboarding or Training Processes

Example flow chart

Outline steps new participants follow from introduction to completion.


Software or Algorithm Logic

Example flow chart
Example flow chart

Show how decisions and conditions determine outcomes within a system.


Project Planning or Decision Trees

Example flow chart
Example flow chart
Example flow chart

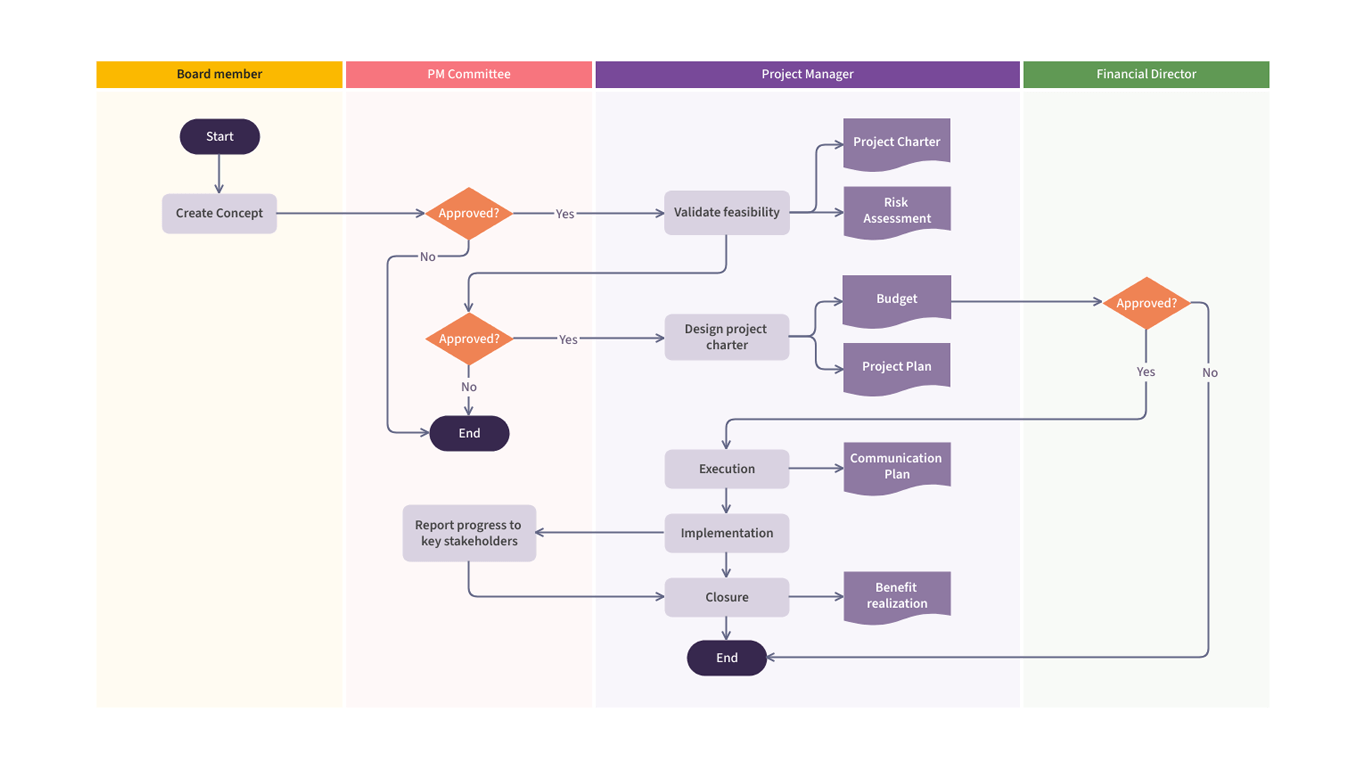
Visualize branching choices and planning paths within complex projects.


What to Avoid or Be Careful Of with a Flowchart

❌ Don’t overcrowd the diagram
Too many shapes or crossing lines make the process harder to follow.

❌ Don’t ignore standard conventions
Consistent shapes and arrows help viewers recognize meaning quickly.

❌ Don’t skip labeling
Every step and decision should be clearly described to avoid confusion.

❌ Don’t create unnecessary branches
Extra decision points can complicate the logic and distract from the main path.

❌ Don’t treat it as decoration
Flowcharts should clarify processes, not simply illustrate them aesthetically.


*Content on this page was curated and edited by expert humans with the creative assistance of AI.

  • facebook
  • instagram
  • linkedin

DON'T MISS ANY SPOT-ON TIPS!

We don't spam! You'll only get emails when we post something awesome.
You can unsubscribe at any time.

Check your inbox or spam folder to confirm your subscription.

©2025 | The Comm Spot | By Newbold Communication & Design