
Word Cloud: How to Visualize Text Through Frequency and Emphasis
A word cloud helps visualize text data by displaying words in varying sizes based on frequency or importance. Use it to reveal themes, highlight recurring language, or give audiences a quick visual summary of large bodies of text.
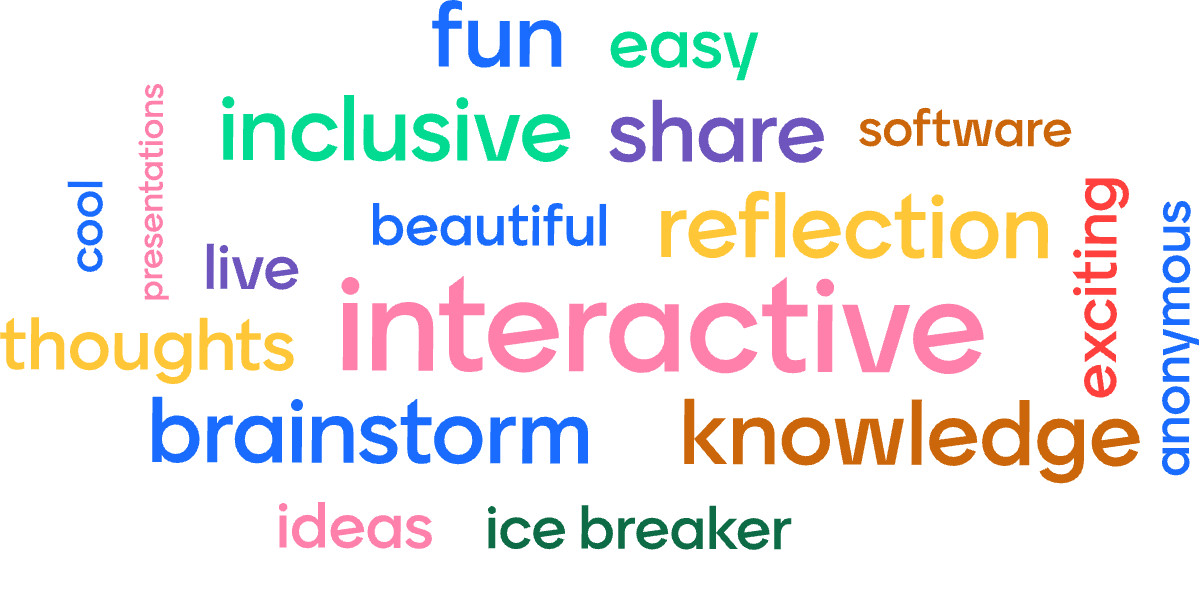
Turn to a word cloud when the goal is exploration or storytelling rather than precise measurement. Instead of presenting rows of text or numeric counts, the visual emphasizes which words stand out most. Larger words draw attention, helping viewers identify patterns or dominant ideas quickly.
Word clouds are especially effective in presentations, qualitative research summaries, and creative analytics where the visual impression of language matters as much as exact numbers.
Related Charts and Graphs
Several visuals relate closely to word clouds and may be better choices depending on the goal.
- Bar charts provide precise comparisons of word frequency rather than visual emphasis.
- Heatmap matrices show text patterns across categories or documents.
- Network diagrams reveal relationships between words rather than individual prominence.
- Timelines highlight when themes appear over time instead of how often they occur.
- Topic modeling visualizations group words into conceptual clusters rather than sizing them individually.
Choosing between these options depends on whether the focus is storytelling, precision, or structural analysis.
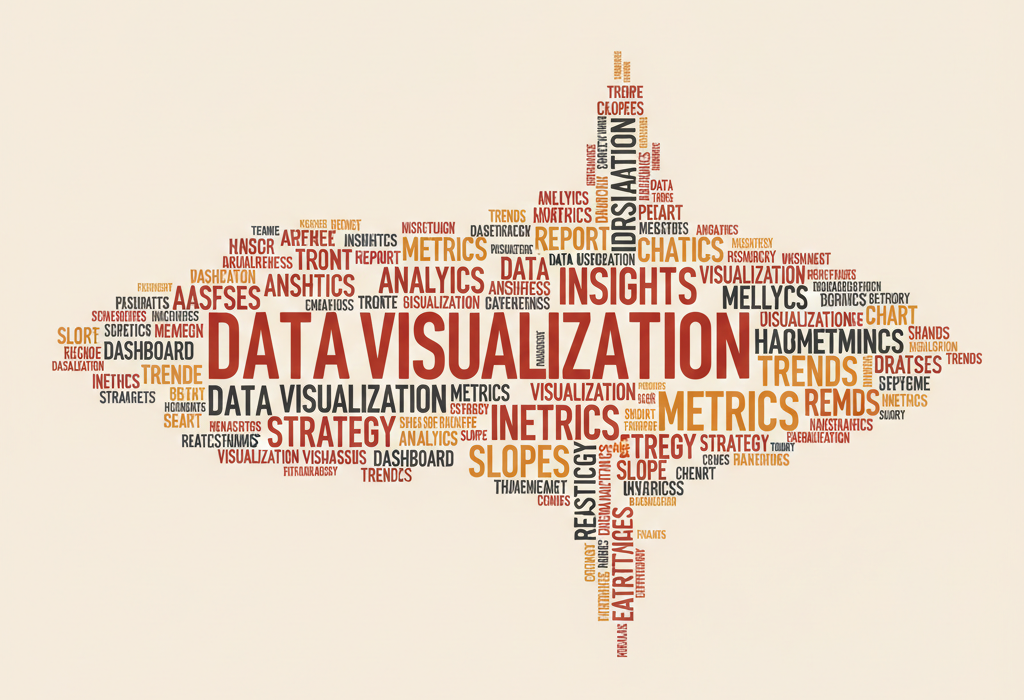
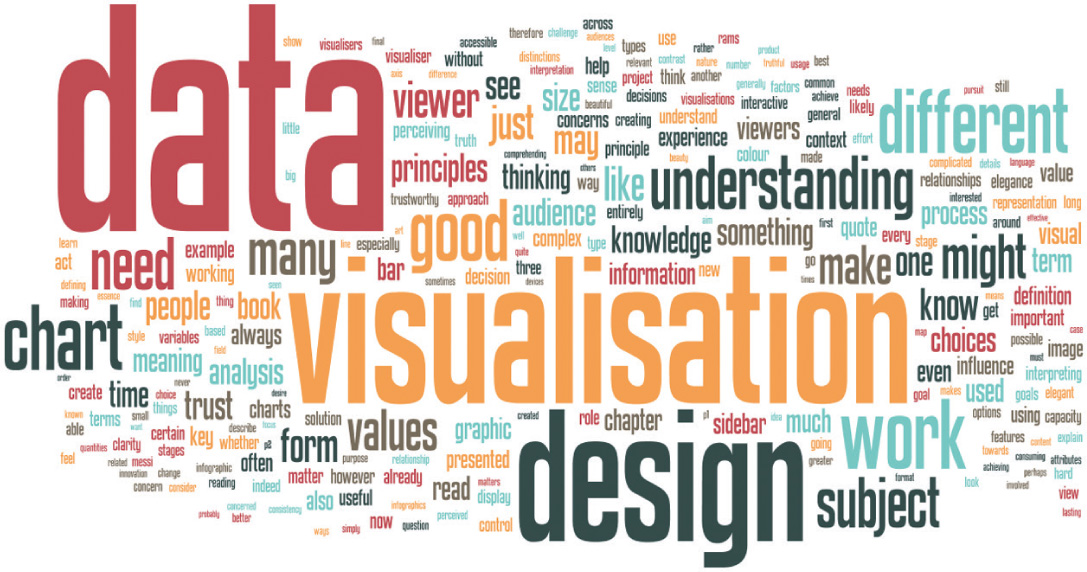
What a Word Cloud Is
A word cloud displays words arranged in a visual layout where size, color, or placement represents importance or frequency. The most common words typically appear larger, while less frequent words remain smaller.
Common elements include:
- Words sized by frequency or weight
- A non-linear layout that fills space creatively
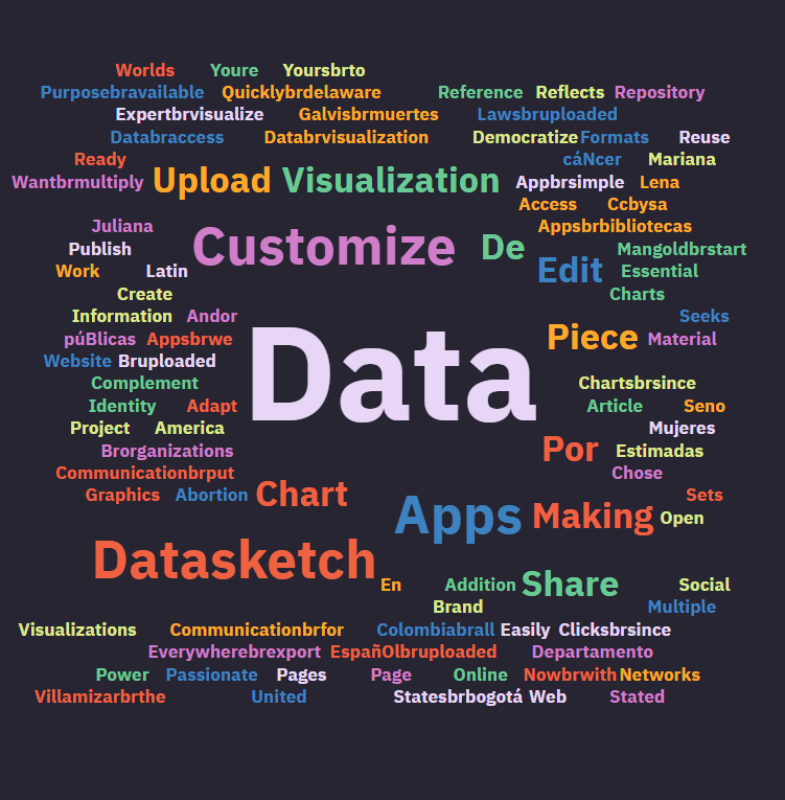
- Color or styling to add visual emphasis
- Minimal axes or numeric scales
Unlike traditional charts, word clouds rely on visual impression rather than exact measurement. The arrangement may appear random or shaped to fit a design, such as a circle, icon, or silhouette.
Because of their simplicity, word clouds often serve as an entry point into text analysis. They allow viewers to grasp the general tone or focus of a dataset without needing to interpret complex metrics.
When to Use a Word Cloud
Use a word cloud when the goal is to communicate themes, tone, or recurring language in a visually engaging way.
This visual works especially well when the goal is to:
- Summarize survey responses or open-ended feedback
- Highlight keywords from speeches or articles
- Introduce qualitative research findings
- Add visual interest to reports or presentations
- Encourage audience exploration of language patterns
Word clouds work best when precision is less important than visual impact. They provide an overview rather than a detailed analysis, making them ideal for storytelling or introductory exploration.
Types of Data Sets That Work Best for a Word Cloud
Word clouds work best with large collections of text where frequency or importance can be measured.
Strong candidates include:
- Survey comments or qualitative responses
- Social media posts or hashtags
- Speeches or transcripts
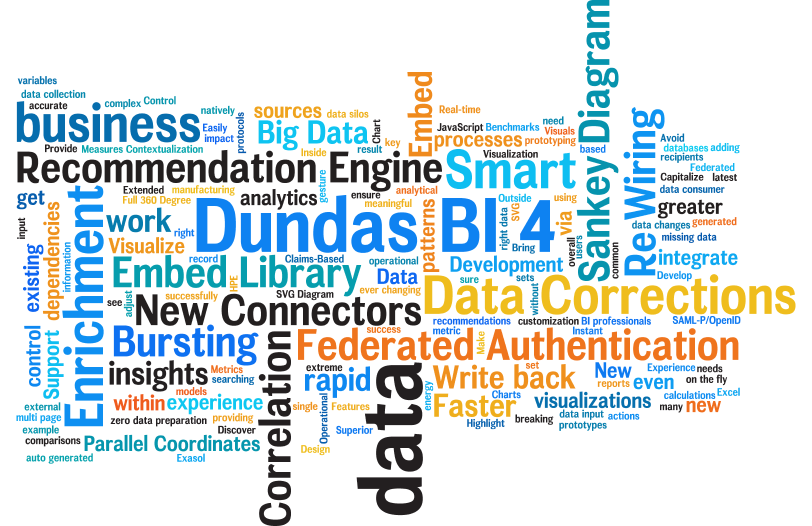
- Product reviews or customer feedback
- News articles or blog content
- Academic abstracts or research summaries
Preprocessing often improves clarity. Removing common stop words, combining similar terms, or applying stemming techniques can make the visualization more meaningful.
Word clouds also benefit from thoughtful design choices. Consistent fonts and balanced spacing help maintain readability, especially when words vary widely in size.
Real-World Examples of a Word Cloud
Word clouds appear frequently in education, journalism, marketing, and research communication where text-based storytelling matters.
Survey Responses or Public Opinion


Show dominant themes emerging from open-ended feedback.
Social Media or Hashtag Analysis

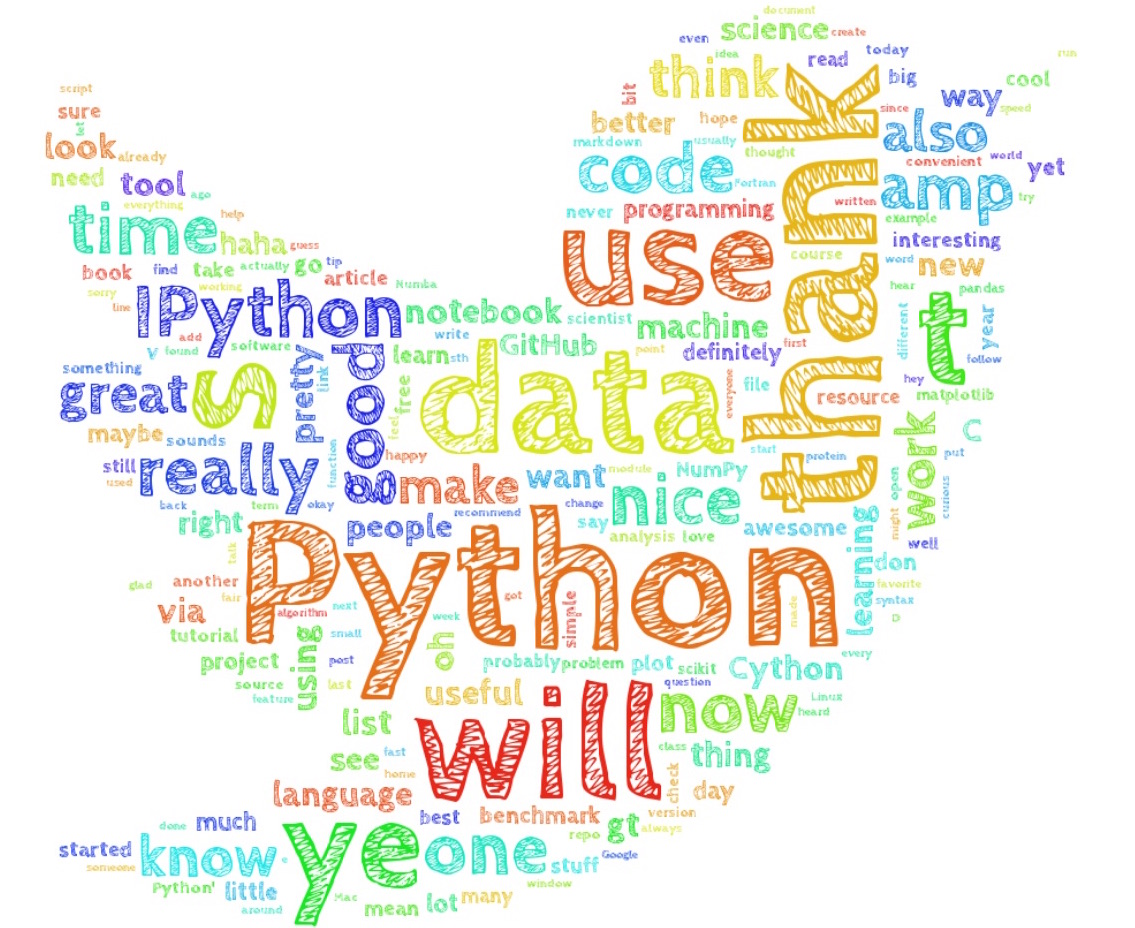
Highlight frequently discussed topics within online conversations.
Speeches or Written Content Analysis
Reveal recurring themes or rhetorical focus within documents.
Education or Classroom Activities


Engage students by visualizing shared ideas or responses.
Marketing or Brand Messaging

Show how language aligns with messaging strategies or audience perception.
What to Avoid or Be Careful Of with a Word Cloud
❌ Don’t treat size as precise measurement
Word clouds emphasize relative prominence, not exact counts.
❌ Don’t include unfiltered text
Removing stop words and irrelevant terms improves clarity.
❌ Don’t rely on complex shapes that distort readability
Design should support interpretation, not distract from it.
❌ Don’t assume viewers understand context automatically
Labels or explanations help connect words to meaning.
❌ Don’t use word clouds when detailed analysis is required
Bar charts or frequency tables often communicate quantitative insights more clearly.
*Content on this page was curated and edited by expert humans with the creative assistance of AI.