
Gantt Chart: How to Show Timelines, Tasks, and Project Progress
A Gantt chart is what you use when timing, sequencing, and coordination matter. It shows how tasks unfold over time and how they relate to one another within a project.
Instead of asking, “What needs to be done?”
the question becomes, “When does it happen, and how does it connect?”
What a Gantt Chart Is
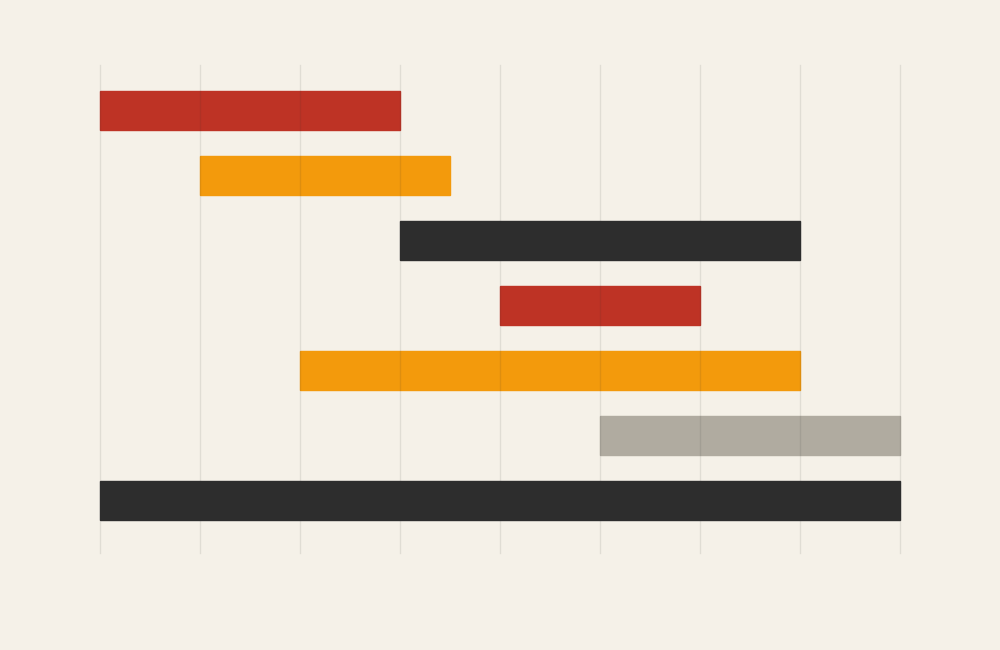
A Gantt chart visualizes a project schedule using horizontal bars placed along a timeline. Each bar represents a task, and the length of the bar shows the task’s duration. The position of the bar indicates start and end dates.
Many Gantt charts also include:
- Dependencies between tasks
- Milestones
- Overlapping activities
- Progress indicators
The core idea is simple: tasks on the vertical axis, time on the horizontal axis.
When to Use a Gantt Chart
Use a Gantt chart when planning, managing, or communicating a project that unfolds over time.
This chart works especially well when the goal is to:
- Plan task sequences and timelines
- Coordinate work across people or teams
- Visualize dependencies and overlaps
- Track progress against a schedule
- Communicate project status clearly
- Anticipate bottlenecks or delays
A Gantt chart is most effective when the key question is:
“What is happening when, and in what order?”
Types of Data Sets That Work Best for a Gantt Chart
Gantt charts work best with task-based, time-structured data.
Strong candidates include:
- Project plans with defined tasks
- Construction or development schedules
- Research or production timelines
- Event planning workflows
- Curriculum or training rollouts
- Any initiative with clear start and end dates
Each task must have a duration, even if it’s estimated.
Real-World Examples of a Gantt Chart
Gantt charts are common in project management, operations, education, and research.
Project Planning and Management

Map out tasks, durations, and dependencies to keep projects on track.
Construction or Engineering Schedules
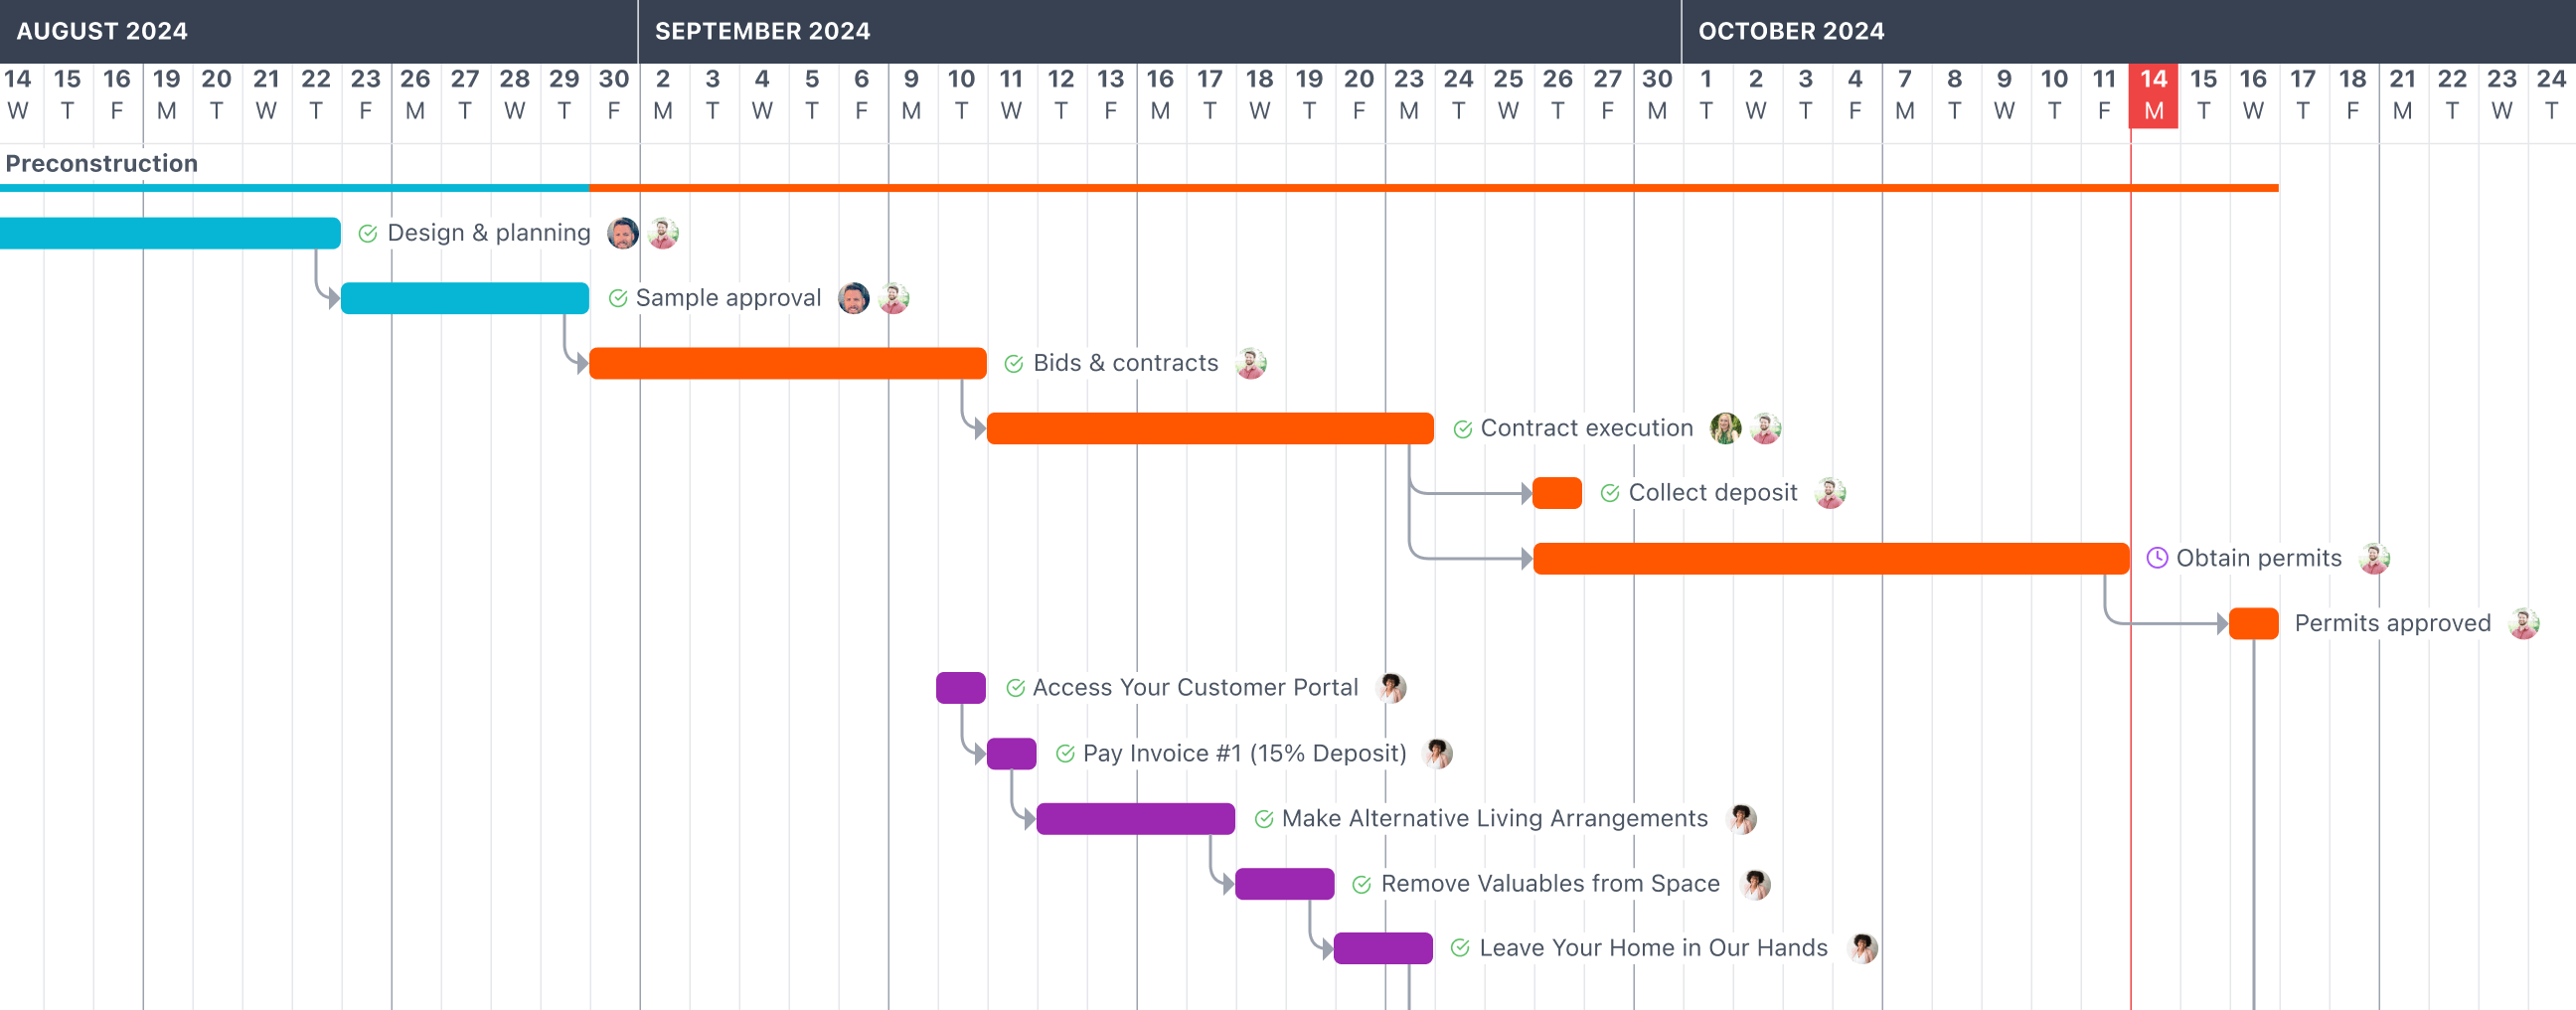

Coordinate complex, overlapping phases and track progress across long timelines.
Product Development or Software Releases

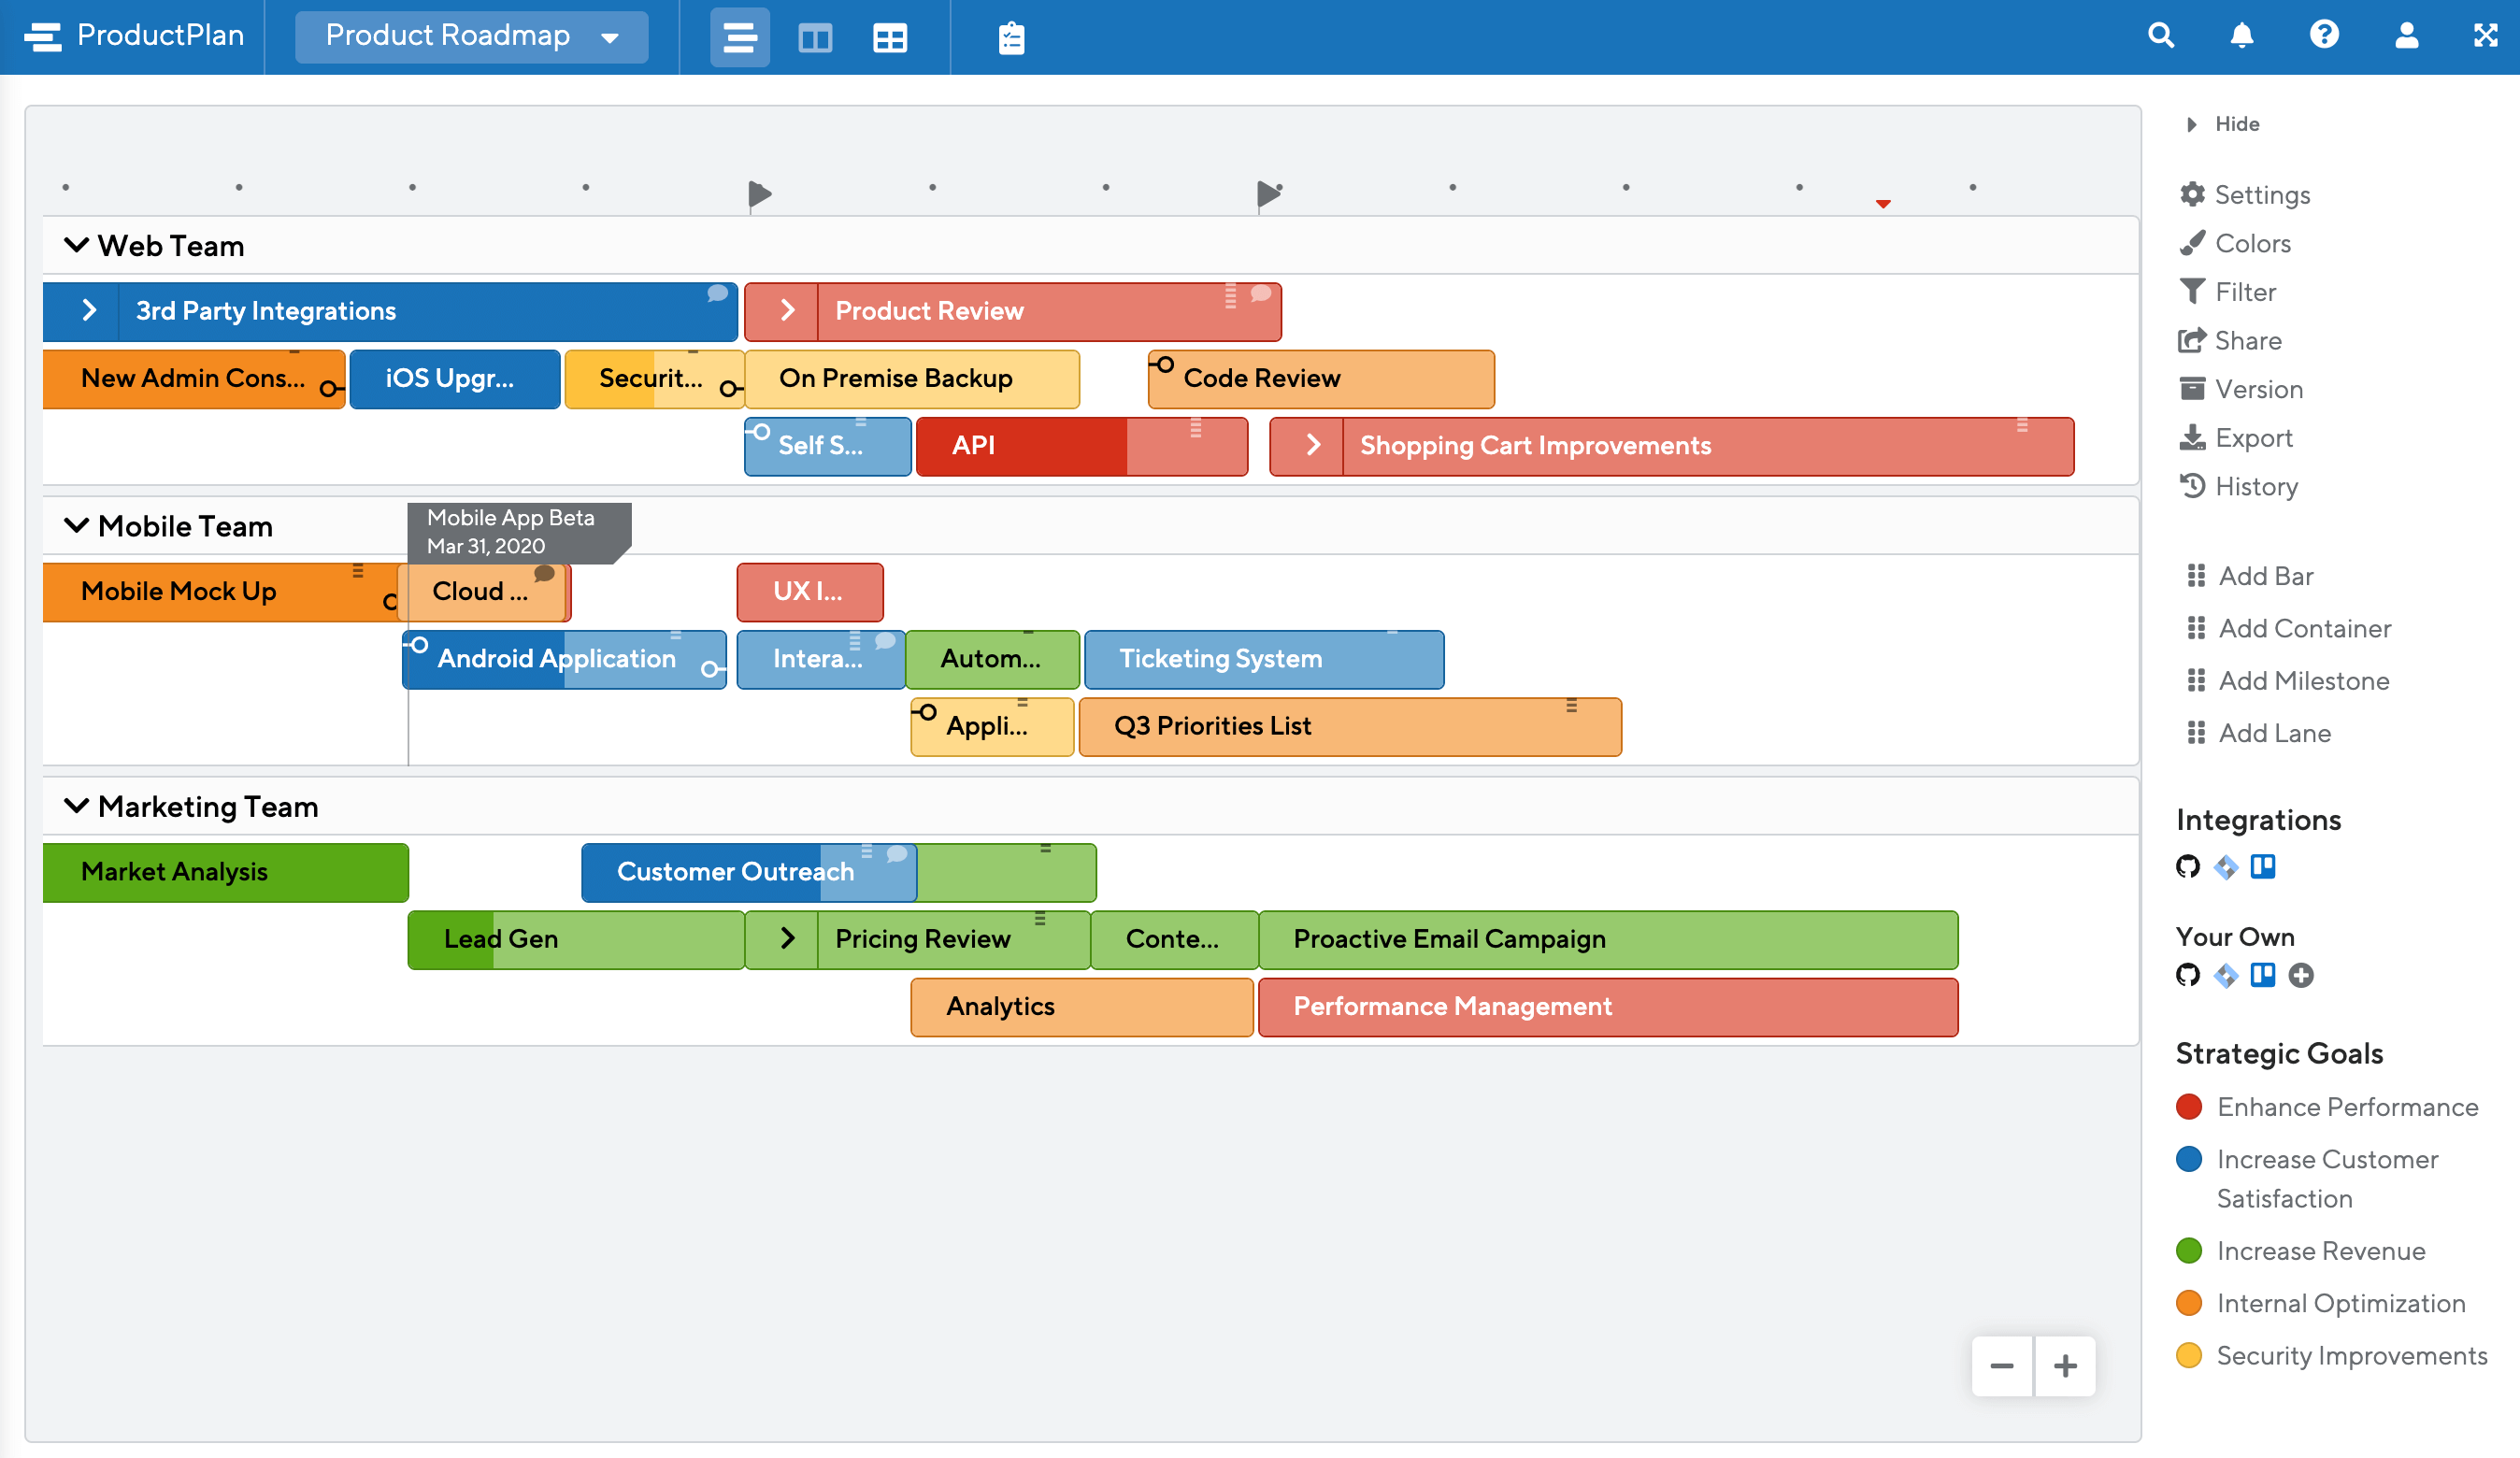
Plan feature development, testing, and launch milestones.
Research or Academic Timelines
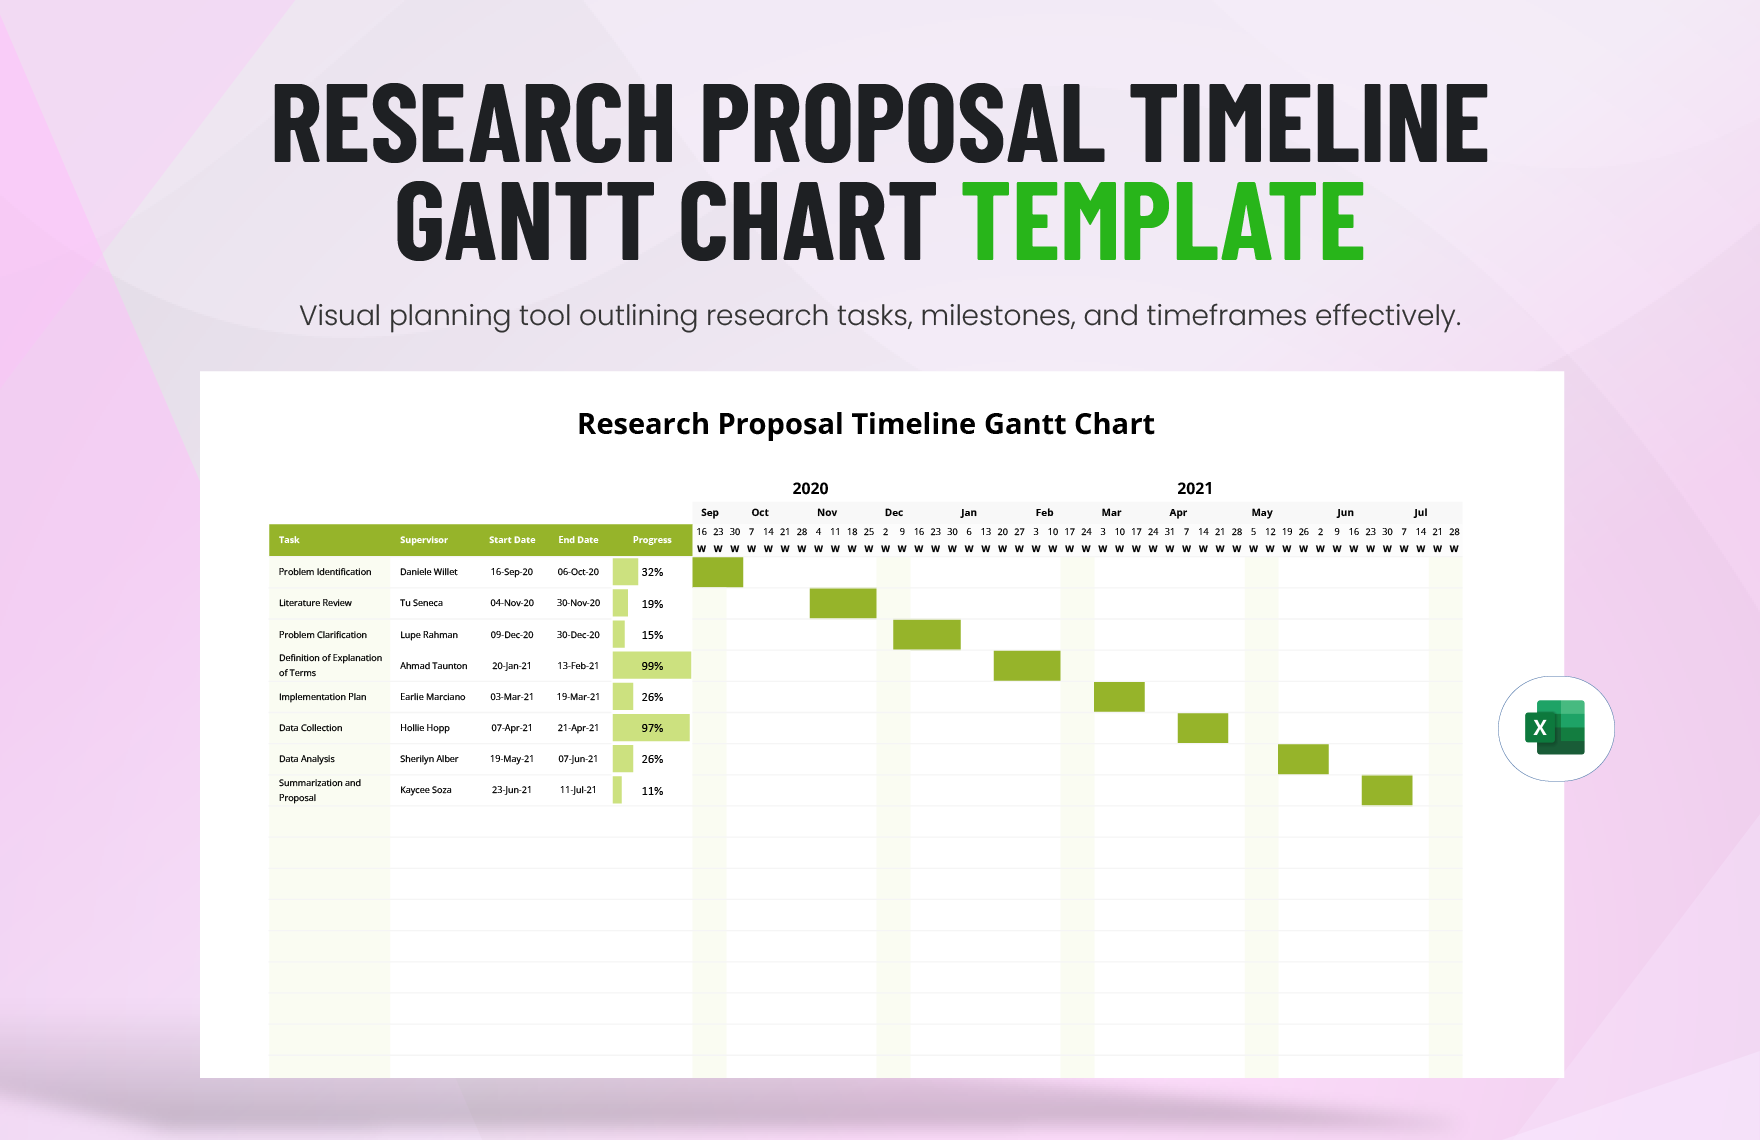
Organize phases like data collection, analysis, and writing.
Event Planning and Coordination


Align logistics, marketing, and execution tasks leading up to an event.
What to Avoid or Be Careful Of with a Gantt Chart
❌ Don’t overcomplicate the chart
Too many tasks or dependencies can overwhelm viewers. High-level Gantt charts work best for communication.
❌ Don’t treat dates as fixed when they aren’t
Gantt charts often create a false sense of certainty. Revisit and revise as projects evolve.
❌ Don’t ignore dependencies
Missing dependencies hide risks and can make timelines unrealistic.
❌ Don’t use it for simple task lists
If timing or sequencing doesn’t matter, a checklist is often clearer.
❌ Don’t forget progress indicators
Without showing completion or status, a Gantt chart becomes a static plan rather than a management tool.
*Content on this page was curated and edited by expert humans with the creative assistance of AI.