Skip to content
The Comm Spot The Comm Spot

It's All About Communication

  • HOME
  • ABOUT
    • Meet the Creator: Curtis Newbold, PhD
    • Hire Curtis
    • Publish with Us
    • Contact
    • Privacy Notice
  • COMM-BASICS
    • Glossary
    • Citation & Style Guides
      • AP Style (Journalism)
        • AP Style Overview
        • AP Style Guidelines
        • Media Ethics – SPJ Code of Ethics
        • Elements of Newsworthiness
      • APA Style
        • APA Format – Overview
        • APA - References Guidelines
        • APA - In-text Citations
        • APA - Citing Authors
        • APA - Audiovisual Media
        • APA - Books
        • APA - Digital Sources
        • APA - Events & Interactions
        • APA - Periodicals
        • APA - Print Sources (other than books)
      • Chicago Style
        • Chicago – Overview
        • Chicago - Author-Date System
        • Chicago - Notes-Bibliography System
        • Chicago - In-text Citations
        • Chicago Style - Citing Authors
        • Chicago - Audiovisual Media
        • Chicago - Books
        • Chicago - Digital Sources
        • Chicago - Events and Interactions
        • Chicago - Citing Periodicals
        • Chicago - Print Sources (other than books)
      • MLA Style
        • MLA Overview
        • MLA Works Cited Pages
        • MLA In-text Citations
        • MLA – Authors
        • MLA – Audiovisual Media
        • MLA – Books
        • MLA – Digital Sources
        • MLA – Events & Interactions
        • MLA – Periodicals
        • MLA – Print Sources (other than books)
    • Rhetoric
      • Overview of Rhetoric
      • Rhetorical Appeals (Rhetorical Triangle)
      • Branches of Oratory
      • Canons of Rhetoric
      • Rhetorical Devices
      • Kairos
      • Topos
      • Key Figures in Rhetoric
    • Research Methods
      • Case Studies
      • Competitor Analysis
      • Content Analysis
      • Discourse Analysis
      • Ethnography
      • Focus Groups
      • Observation Research
      • S.W.O.T. Analysis
      • Secondary Research
      • Surveys
      • Target Market Analysis
      • Usability Testing
      • Visual Analysis
    • Theories
    • Thinkers
  • COMM-SUBJECTS
    • Interpersonal Communication
      • Active Listening
      • Body Language
      • Conflict Management
      • Emotional Intelligence
        • Emotional Intelligence Overview
        • Self-Awareness
        • Self-Regulation
        • Motivation
        • Empathy
        • Social Skills
        • Emotional Intelligence Resources
      • Feedback
      • Negotiation
        • Overview of Negotiation
        • Negotiation Skills
        • Negotiation Strategies & Techniques
        • Stages of Negotiation
        • Common Negotiation Scenarios
        • Negotiation Case Studies & Examples
        • Negotiation Tools & Resources
        • Negotiation FAQ
    • Journalism
    • Public Speaking
      • General Guidelines
      • Overcoming Fear
      • Speech Writing and Organization
      • Delivery Techniques
      • Body Language
      • Audience Engagement
      • Storytelling
      • Designing Slides
      • P.O.W.E.R.F.U.L. Presentation Method
    • Strategic Communication
      • Business & Org Comm
        • Definition & History
        • Org Comm Theories
        • Business Documents
        • Change Management
        • Employee Relations
        • Employment Communication
        • Group & Team Communication
        • Leadership Communication
        • Power, Identity, & Ethics at Work
        • Project Management
      • Integrated Marketing Comm
        • Definition of IMC
        • Core Principles of IMC
        • IMC Planning
        • Audience Segmentation
        • Marketing Channels
        • Message Strategies
        • Campaign Measurement & Evaluation
        • Trends & Innovations in IMC
        • Challenges & Pitfalls in IMC
        • Careers & Roles in IMC
      • Public Relations
        • Foundations in PR
        • Strategic Practice
        • Tools & Tactics
        • Research & Analysis
        • Professional Development
      • Case Studies in Strat Comm
    • Technical & Scientific Communication
    • Visual Communication
      • Data Visualization
      • Information Design
      • Photography
      • Web Design
    • Written Communication
      • Writing Process
      • Organizational Methods
        • Five Paragraph Essay
        • Hourglass Method of Writing
        • IMRaD Format (Science)
        • Indirect Method (Bad News)
        • Inverted Pyramid (Journalism)
        • Martini Glass
        • Narrative Format
        • Proposal Format
        • Rogerian Method
        • Toulmin Method
      • Plain Language
        • Audience (Plain Language)
        • Organization (Plain Language)
        • Conversation (Plain Language)
        • Simplicity (Plain Language)
        • Word Choice (Plain Language)
        • Sentence Structure (Plain Language)
        • Design (Plain Language)
      • Punctuation
        • Apostrophes
        • Brackets
        • Colons
        • Commas
        • Ellipses
        • Em Dashes
        • En Dashes
        • Exclamation Marks
        • Hyphens
        • Parentheses
        • Periods
        • Question Marks
        • Quotation Marks
        • Semicolons
      • Style
        • Clarity
        • Conciseness
        • Consistency
        • Editing
        • Flow
        • Rhetorical Devices
        • Sentence Structure
        • Storytelling
        • Tone
        • Voice
        • Word Choice
  • RESOURCES
    • Teaching Resources
      • Assignments & Activities
      • Instructional Design
      • Pedagogies
  • BLOGS
    • The Spotlight Blog
    • Comm Sparks
  • SHOP
    • Cart
    • Checkout
0
The Comm Spot
The Comm Spot

It's All About Communication

Bump Chart – Data Visualization

Home >COMM-Subjects >Visual Communication >Data Visualization >Types of Data Visualizations (Charts and Graphs) >Bump Chart – Data Visualization

Bump Chart: How to Show Rank Changes Over Time

A bump chart is what you use when the story isn’t about values—it’s about rank. It shows how categories move up and down relative to one another across time or ordered stages.

Instead of asking, “How much did this change?”
the question becomes, “Who rose, who fell, and who stayed dominant?”


What a Bump Chart Is

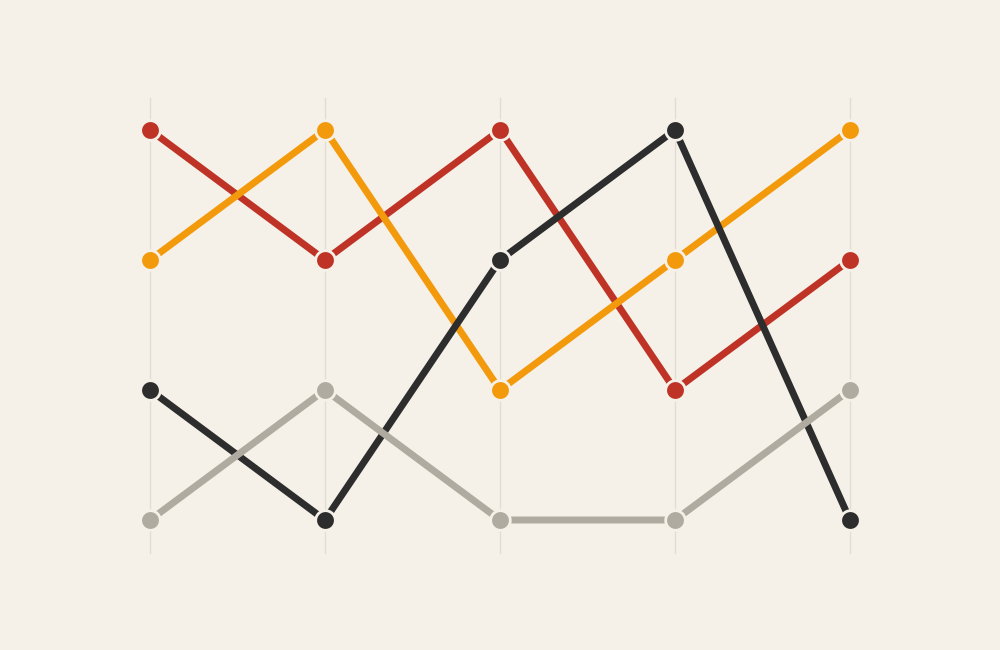
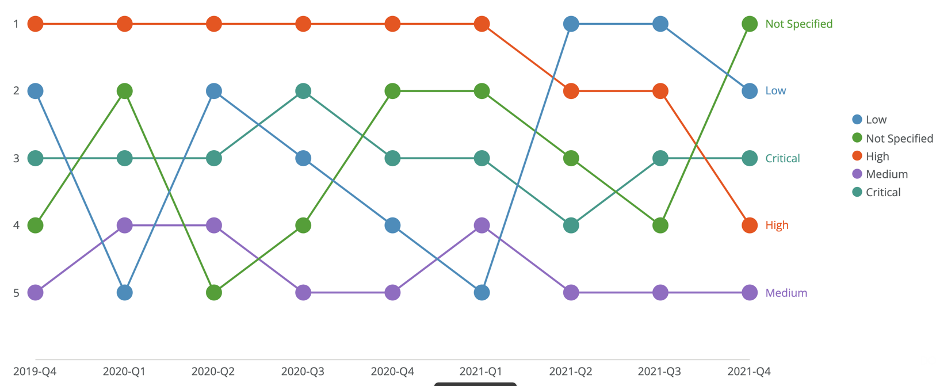
A bump chart visualizes rank order over time. Each line represents a category, and the vertical position of that line shows its rank at each point along the horizontal axis (usually time).

The most important thing to understand is this:
the y-axis does not represent magnitude—it represents position.

Rank 1 might be far ahead or barely ahead. A bump chart doesn’t show the gap; it shows the order.

If a line chart shows trends in value, a bump chart shows competition and movement.


When to Use a Bump Chart

Use a bump chart when relative position matters more than exact numbers.

A bump chart works best when the goal is to:

  • Show changes in ranking over time
  • Highlight volatility or stability in position
  • Emphasize competition between categories
  • Reveal dominant players and challengers
  • Tell a story about movement, not scale

This chart is a strong choice when the key question is:

“How did the rankings change?”


Types of Data Sets That Work Best for a Bump Chart

Bump charts work best with ordinal data derived from quantitative measures.

Strong candidates include:

  • Rankings over time (sports, sales, popularity)
  • Market share rankings by year
  • Search or social media trends by position
  • Polling or approval rankings
  • Performance rankings across periods
  • Competitive standings

The data must be rankable at each time point, even if the underlying values are very close.


Real-World Examples of a Bump Chart

Bump charts are especially effective when competition, hierarchy, or dominance is the story.

Sports Rankings or League Standings

https://upload.wikimedia.org/wikipedia/commons/a/a4/2022%E2%80%9323_EPL_bump_chart.svg

Tracks how teams move up and down the standings across a season or multiple seasons.


Search Trends or Popularity Rankings

https://cdn.prod.website-files.com/67af3db5bb3b892e61258bd4/695eb351660265effcefe197_bump-chart-example.png
https://datawrapper.dwcdn.net/9GN07/full.png

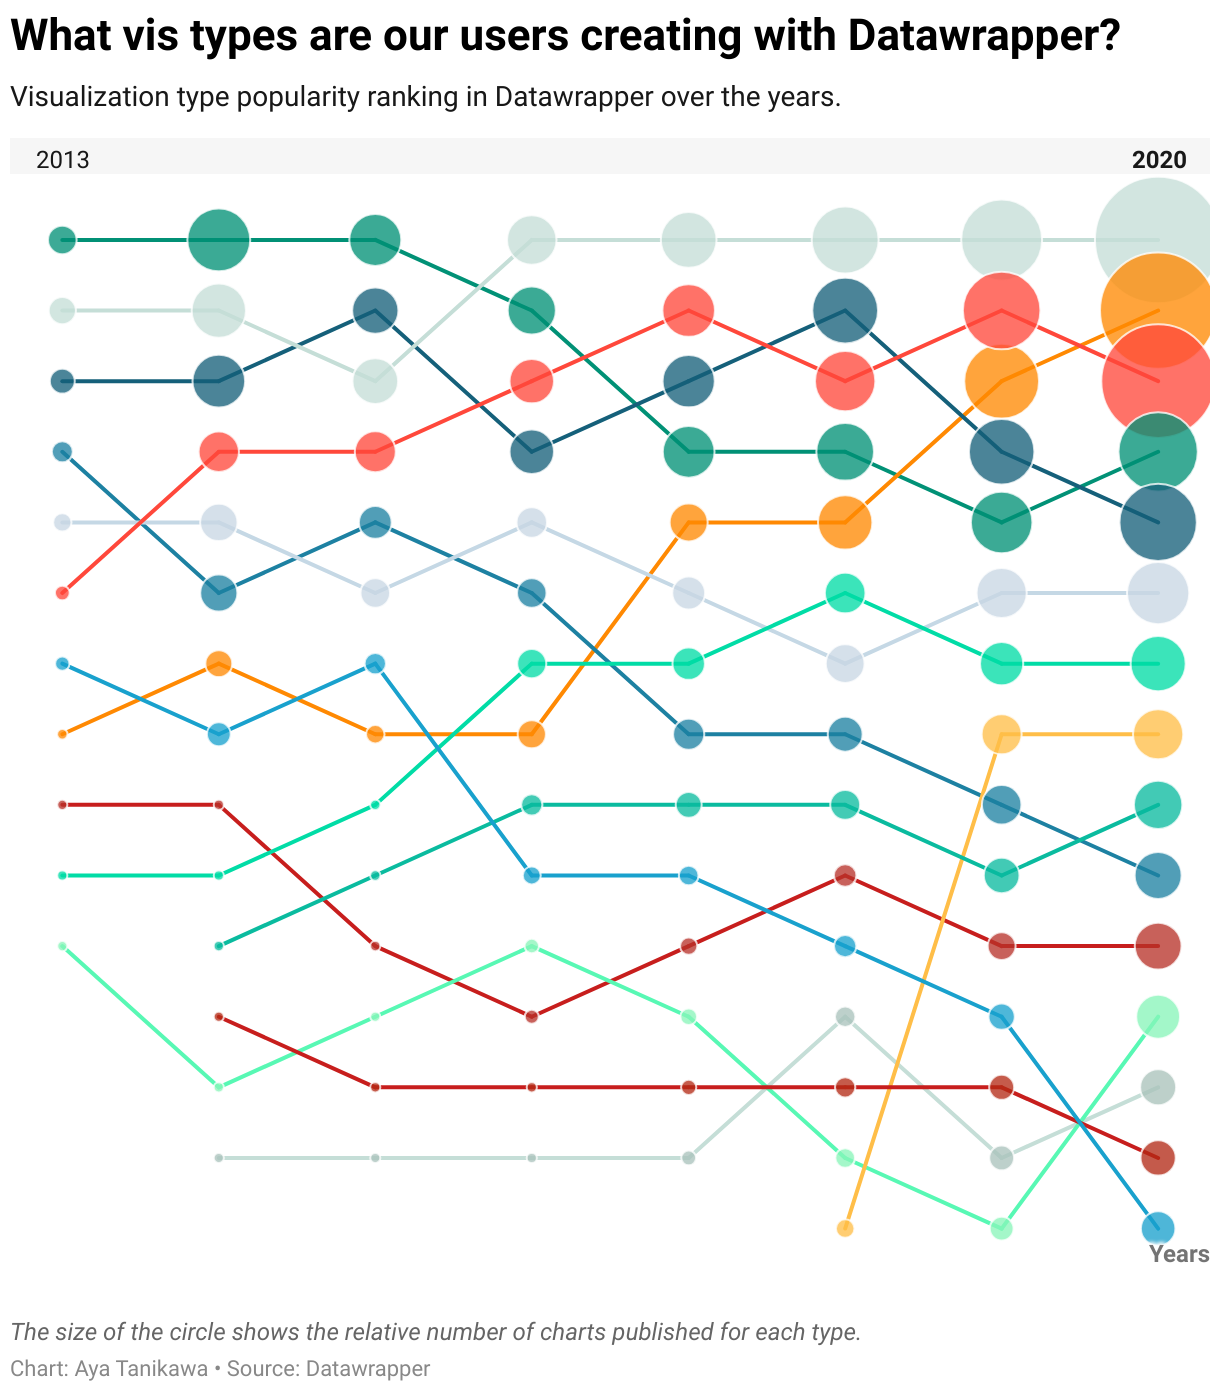
Illustrates how topics, products, or names gain or lose relative attention over time.


What to Avoid or Be Careful Of with a Bump Chart

❌ Don’t use it when exact values matter
Bump charts intentionally hide magnitude. If the size of the difference matters, this is the wrong chart.

❌ Don’t use too many categories
Too many lines create visual clutter and make rank changes hard to follow.

❌ Don’t ignore labeling
Lines cross frequently. Clear labels at the start or end are essential for readability.

❌ Don’t use uneven or unclear time intervals
The horizontal axis must reflect a meaningful, consistent progression.

❌ Don’t assume rank is intuitive
Viewers may forget that the y-axis represents order, not value. A short explanation often helps.


*Content on this page was curated and edited by expert humans with the creative assistance of AI.

  • facebook
  • instagram
  • linkedin

DON'T MISS ANY SPOT-ON TIPS!

We don't spam! You'll only get emails when we post something awesome.
You can unsubscribe at any time.

Check your inbox or spam folder to confirm your subscription.

©2025 | The Comm Spot | By Newbold Communication & Design