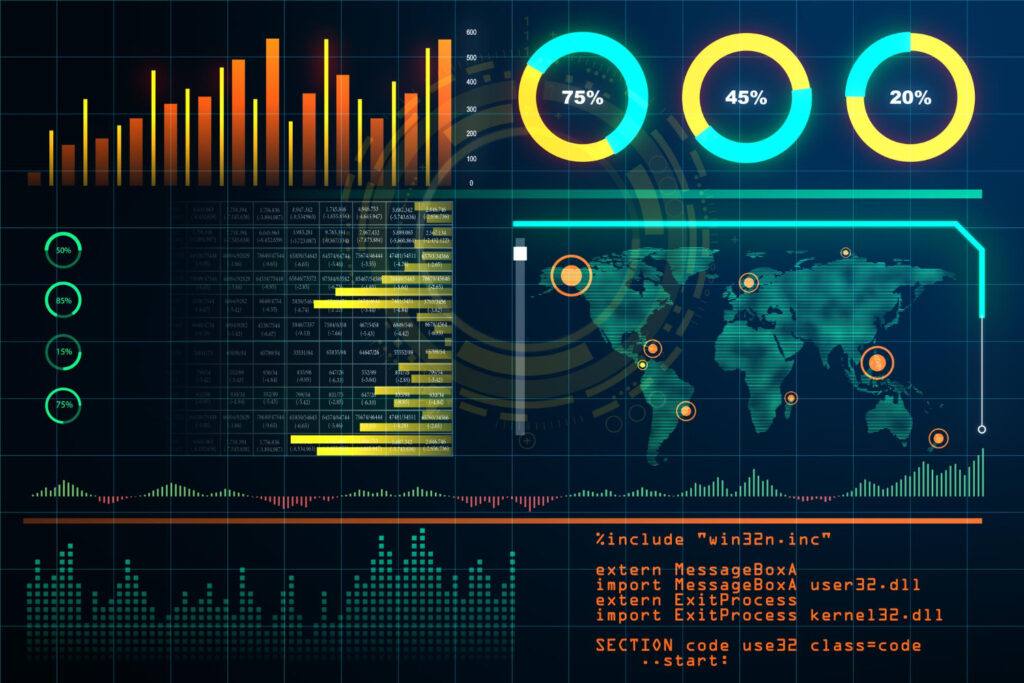
Data Visualization, in a nutshell, is the art and science of transforming information into visual stories that reveal meaning, patterns, and insight. Whether you’re interpreting survey results, presenting research findings, or communicating strategy, the way data is visualized shapes how it’s understood and acted upon. Review the content in this section to learn principles, practices, and ethics of effective data visualization—connecting design with clarity, accuracy, and purpose.